こんにちは(@t_kun_kamakiri)
本記事ではOpenFOAMを使って3次元ダムブレイクのメッシュ作成・解析設定と実験データとの比較に関して、実験データとOpenFOAMの結果を比較するPythonスクリプトを紹介します。
3次元ダムブレイクの実験データとOpenFOAMの結果をPythonを使って比較する
本記事は、以下の記事で解析設定と実行を行った後の結果処理に関する内容ですので先に下記の記事をお読みください。
上の記事内ではgnuplotを使ってグラフ作成をしていますが、グラフ化であればPythonのmatplotlibを使うことで同じことができます。
CAEのモデルや資料などは以下に保存しているのでご参考ください。
対象の実験データの説明
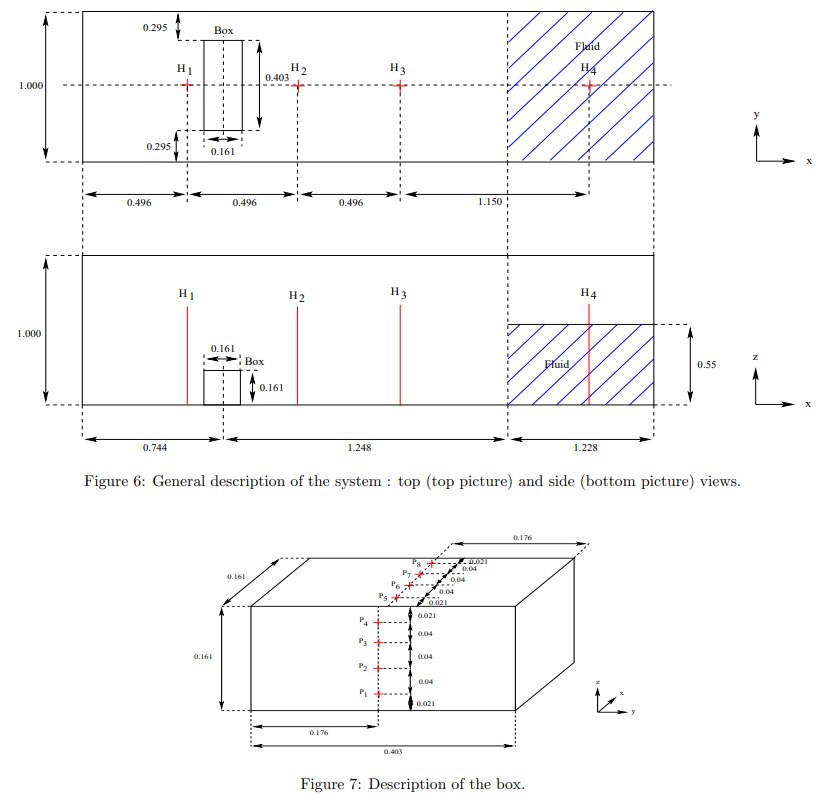
3次元ダムブレイクの実験との比較を行うため実験データについては以下のようになっています。OpenFOAMで作成する寸法も実験に合わせて作成しています。
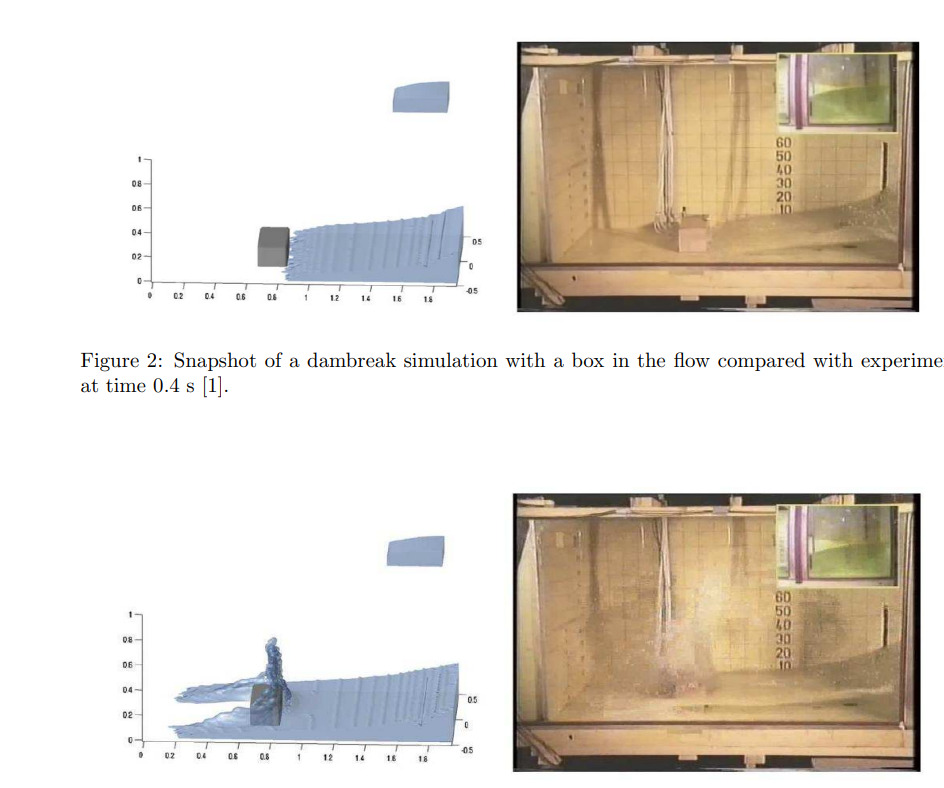
その後水はBoxと書かれた障害物に当たり、水しぶきをあげます。
この時に実験データとして、
- p1~P8の座標で圧力の時刻歴
- H1~H4の座標での水面の高さの時刻歴
という時刻歴データを測定しています。
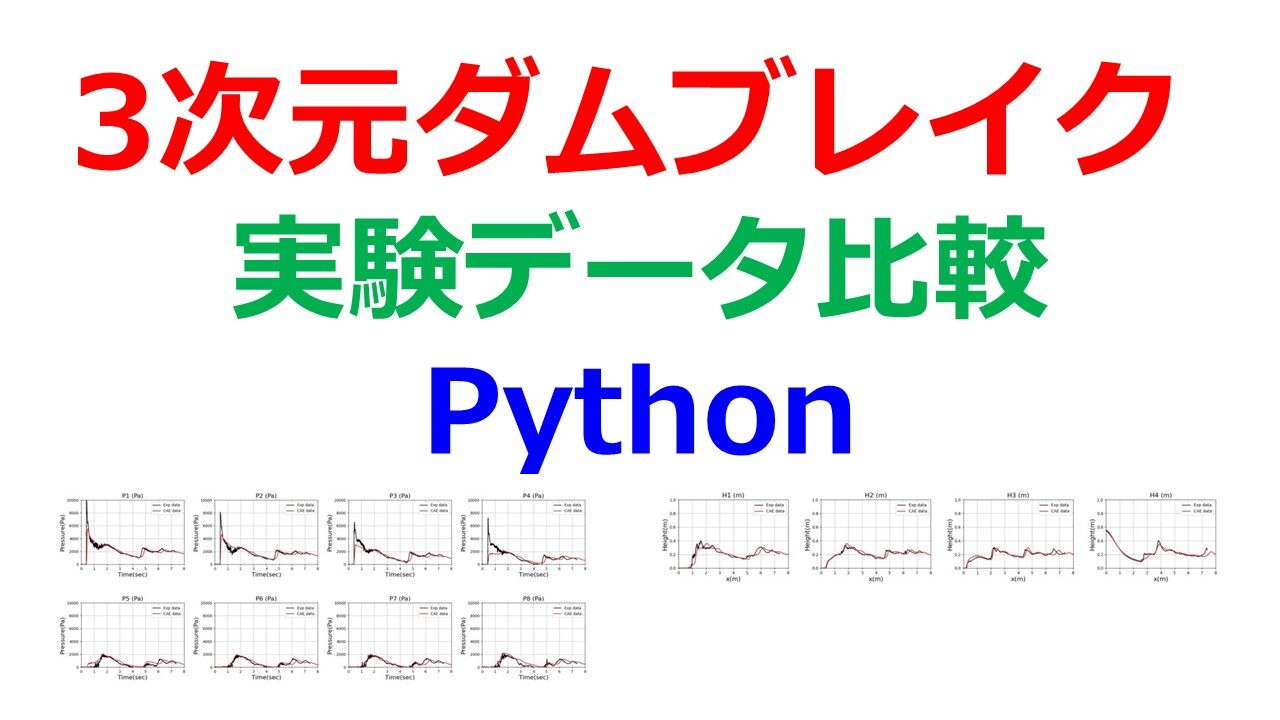
本記事ではこちらの時刻歴データをOpenFOAMでも計測し、実験データとOpenFOAMを使ったCAE解析の比較を行いたいと思います。
3次元ダムブレイクの実験データとOpenFOAM比較。
ちょっと理解できた。 pic.twitter.com/GpFELWtwWj— カマキリ🐲Python頑張る昆虫 (@t_kun_kamakiri) May 27, 2022
最終的にはツイートであげたような結果となります。
実務では、実験データとCAE解析の結果に対して精度良く再現できているかどうかを確認して使用することがあり「実験検証 コリレーション」と呼ばれています。
グラフ化のPythonコード
使用環境は以下です。
水位の時刻歴を出力するinterfaceHeightについてはv2006のバージョンから導入されたので、並列計算で出力されないなどの不具合がありましたが、v2112では解消されているようです。
しかし、導入されたばかりなので出力フォームがバージョンによって違っていたりするのでv2112をお使いの方は注意が必要です。
※v2006をお使いの方は並列計算なしで計算
※v2112をお使いの方は並列計算でもOK
OpenFOAMの水位のデータは「postProcessing/interfaceHeight/0/height.dat」に出力されます。しかし、v2006とv2112では出力されるフォームが異なるためバージョンに合わせてPythonスクリプトを変える必要があります。
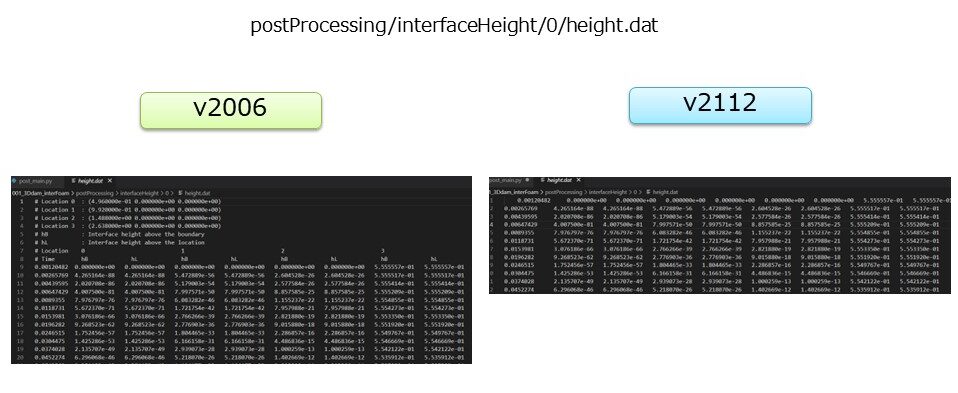
具体的にはv2006ではあったヘッダー部分がv2112ではなくなっているという点です。
おそらくv2006の方が今後デフォルトになると思いますが、並列計算が実行できるのがv2112なので仕様が固まっていないように感じます。この辺りは今後のアップデートに期待ですね。
v2006の場合
|
1 2 3 4 5 6 7 8 9 10 11 12 13 14 15 16 17 18 19 20 21 22 23 24 25 26 27 28 29 30 31 32 33 34 35 36 37 38 39 40 41 42 43 44 45 46 47 48 49 50 51 52 53 54 55 56 57 58 59 60 61 62 63 |
import pandas as pd import matplotlib.pyplot as plt from pathlib import Path import os def graph_photo(df_exp, df_cae, cols_dic): for cols in cols_dic: fig = plt.figure(figsize=(24,8)) plt.subplots_adjust(wspace=0.3, hspace=0.6) for i, point in enumerate(cols_dic[cols][1:]): ax = fig.add_subplot(2,4,i+1) ax.plot(df_exp['Time (s)'], df_exp[point], color='black', label='Exp data') ax.plot(df_cae['Time (s)'], df_cae[point], color='red', label='CAE data') if cols == 'pcolumns': ax.set_xlabel('Time(sec)', fontsize =16) ax.set_ylabel('Pressure(Pa)', fontsize = 16) ax.set_title(f'{point}', fontsize =16) ax.grid() ax.set_xlim(0,8) ax.set_ylim(0, 10000) ax.legend() fig.savefig('./photo/point.jpg') elif cols =='hcolumns': ax.set_xlabel('x(m)', fontsize =16) ax.set_ylabel('Height(m)', fontsize = 16) ax.set_title(f'{point}', fontsize =16) ax.grid() ax.set_xlim(0,8) ax.set_ylim(0, 1) ax.legend() fig.savefig('./photo/height.jpg') else: pass # 実験データの取得 expfile = Path('exp_data/test_case_2_exp_data.csv') df_exp = pd.read_csv(expfile,sep='\t').drop('Unnamed: 9', axis=1) # カラムの取得 cols_dic = { 'pcolumns': df_exp.columns[:9], 'hcolumns': df_exp.columns[9:].insert(0,df_exp.columns[0]) } # CAEデータの取得 caefile_p = Path('postProcessing/probes/0/p') caefile_h = Path('postProcessing/interfaceHeight/0/height.dat') # df_cae = pd.read_table(caefile, skiprows=skiprows_list, header=0, sep='\t') df_cae_p = pd.read_csv(caefile_p, skiprows=[0,1,2,3,4,5,6,7,8,9], header=None, delim_whitespace=True).set_axis(cols_dic['pcolumns'],axis=1) #pressure data df_cae_h = pd.read_csv(caefile_h, skiprows=[0,1,2,3,4,5,6,7], header=None, delim_whitespace=True, usecols=[0,2,4,6,8]).set_axis(cols_dic['hcolumns'],axis=1) #height data df_cae = df_cae_p.merge(df_cae_h) # CAEデータ pとhの結合 # make photo dir if not os.path.exists('photo'): os.mkdir('photo') # mainグラフ作成 graph_photo(df_exp, df_cae, cols_dic) |
pythonを実行するとphotoというフォルダが作成され、その中に
- point.jpg:圧力データの比較
- height.jpg:水位データの比較
が出力されます。
point.jpg:圧力データの比較

v2112の場合
出力のフォームが違うので以下に修正します。
|
1 2 |
#df_cae_h = pd.read_csv(caefile_h, skiprows=[0,1,2,3,4,5,6,7], header=None, delim_whitespace=True, usecols=[0,2,4,6,8]).set_axis(cols_dic['hcolumns'],axis=1) #height data df_cae_h = pd.read_csv(caefile_h, header=None, delim_whitespace=True, usecols=[0,2,4,6,8]).set_axis(cols_dic['hcolumns'],axis=1) #height data |
全体のコードは以下となります。
|
1 2 3 4 5 6 7 8 9 10 11 12 13 14 15 16 17 18 19 20 21 22 23 24 25 26 27 28 29 30 31 32 33 34 35 36 37 38 39 40 41 42 43 44 45 46 47 48 49 50 51 52 53 54 55 56 57 58 59 60 61 62 63 |
import pandas as pd import matplotlib.pyplot as plt from pathlib import Path import os def graph_photo(df_exp, df_cae, cols_dic): for cols in cols_dic: fig = plt.figure(figsize=(24,8)) plt.subplots_adjust(wspace=0.3, hspace=0.6) for i, point in enumerate(cols_dic[cols][1:]): ax = fig.add_subplot(2,4,i+1) ax.plot(df_exp['Time (s)'], df_exp[point], color='black', label='Exp data') ax.plot(df_cae['Time (s)'], df_cae[point], color='red', label='CAE data') if cols == 'pcolumns': ax.set_xlabel('Time(sec)', fontsize =16) ax.set_ylabel('Pressure(Pa)', fontsize = 16) ax.set_title(f'{point}', fontsize =16) ax.grid() ax.set_xlim(0,8) ax.set_ylim(0, 10000) ax.legend() fig.savefig('./photo/point.jpg') elif cols =='hcolumns': ax.set_xlabel('x(m)', fontsize =16) ax.set_ylabel('Height(m)', fontsize = 16) ax.set_title(f'{point}', fontsize =16) ax.grid() ax.set_xlim(0,8) ax.set_ylim(0, 1) ax.legend() fig.savefig('./photo/height.jpg') else: pass # 実験データの取得 expfile = Path('exp_data/test_case_2_exp_data.csv') df_exp = pd.read_csv(expfile,sep='\t').drop('Unnamed: 9', axis=1) # カラムの取得 cols_dic = { 'pcolumns': df_exp.columns[:9], 'hcolumns': df_exp.columns[9:].insert(0,df_exp.columns[0]) } # CAEデータの取得 caefile_p = Path('postProcessing/probes/0/p') caefile_h = Path('postProcessing/interfaceHeight/0/height.dat') df_cae_p = pd.read_csv(caefile_p, skiprows=[0,1,2,3,4,5,6,7,8,9], header=None, delim_whitespace=True).set_axis(cols_dic['pcolumns'],axis=1) #pressure data #df_cae_h = pd.read_csv(caefile_h, skiprows=[0,1,2,3,4,5,6,7], header=None, delim_whitespace=True, usecols=[0,2,4,6,8]).set_axis(cols_dic['hcolumns'],axis=1) #height data df_cae_h = pd.read_csv(caefile_h, header=None, delim_whitespace=True, usecols=[0,2,4,6,8]).set_axis(cols_dic['hcolumns'],axis=1) #height data df_cae = df_cae_p.merge(df_cae_h) # CAEデータ pとhの結合 # make photo dir if not os.path.exists('photo'): os.mkdir('photo') # mainグラフ作成 graph_photo(df_exp, df_cae, cols_dic) |
参考書
PENGUINさんサイトを体系的に学べる書籍となっています。ネット記事でも十分勉強できるのですが、OpenFOAMの初学者でOpenFOAMをインストール済みであれば一冊持って置き、体系的に学ぶのが良いでしょう。
あとは初心者向けに丁寧に解説がされているこちらの書籍もお勧めです。最後の章にはオーバーセットメッシュ(重合メッシュ)の機能を使った解析を最後まで丁寧に解説しているので挫折することはないでしょう。
