こんにちは(@t_kun_kamakiri)(‘◇’)ゞ
前回下記のような記事を出しまして、
前回の記事で示したアニメーションはこんな感じ
1次元グラフのアニメーションができるのならば、gnuplotの「splot」を使って3次元アニメーションも作れるなと思ったので、記事にします(^^)/
2次元の熱伝導方程式をFortranで解いて、gnuplotで3次元アニメーションを作る(^^)/
※FortranのコードはFortran90/95の書き方にしているつもりですが正確に書けているかは不明です。
※FortranはWSLを使ってインストールしています。
※gnuplotはこのサイトを参考にすれば良いかと思います。
2次元熱伝導方程式をFortranで解く
まずは解くべき方程式を明らかにしておきましょう。
全体の流れ
アニメーション作成までの全体の流れを押さえておくと少し気持ちのハードルは下がるかもしれないので、先に全体の流れを示しておきます。
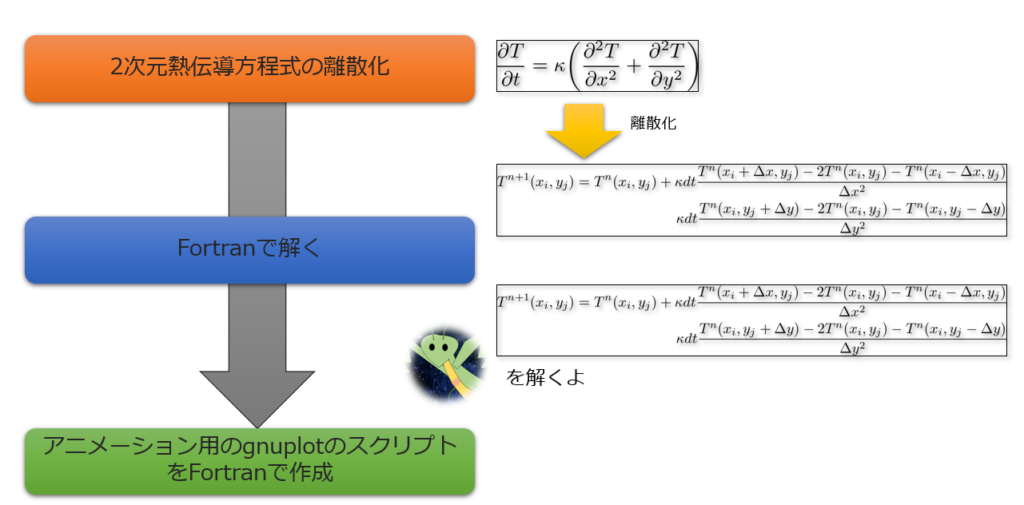

- 2次元熱伝達方程式は偏微分方程式であるため、それを数値的に解くためには離散化してあげる必要があります。
今回は、「時間に対しては陽解法」「空間に対しては2次精度」で解くことを考えています。 - 次にForranを使って離散化した方程式を数値的に解くことを考えます。
(※コードは後ほど) - Fortranで出力したデータをgnuplotで順番に読み込んでいくためのスクリプトをFortranを使って作成します。
これらのことができれば、あとはgnuplotで「3.」で作成されたスクリプトを実行するだけアニメーションを作成することができます。
※1次元熱伝導方程式を題材にしたのは、簡単な方程式の方がアニメーション作成の方法を理解しやすいと思ったからです。
ゆえに、離散化も特にこだわってはいません。
2次元熱伝導方程式の離散化
- 時間微分の項(左辺)は陽解法
- 空間微分の項(右辺)は2次精度
で離散化で進めていきましょう。
\kappa dt\frac{T^{n}(x_{i},y_{j}+\Delta y)-2T^{n}(x_{i},y_{j})-T^{n}(x_{i},y_{j}-\Delta y)}{\Delta y^2}\end{align*}
Fortranで解く
離散化された方程式をFortranで解くためのプログラムを書いていきましょう。
以下がプログラムです。
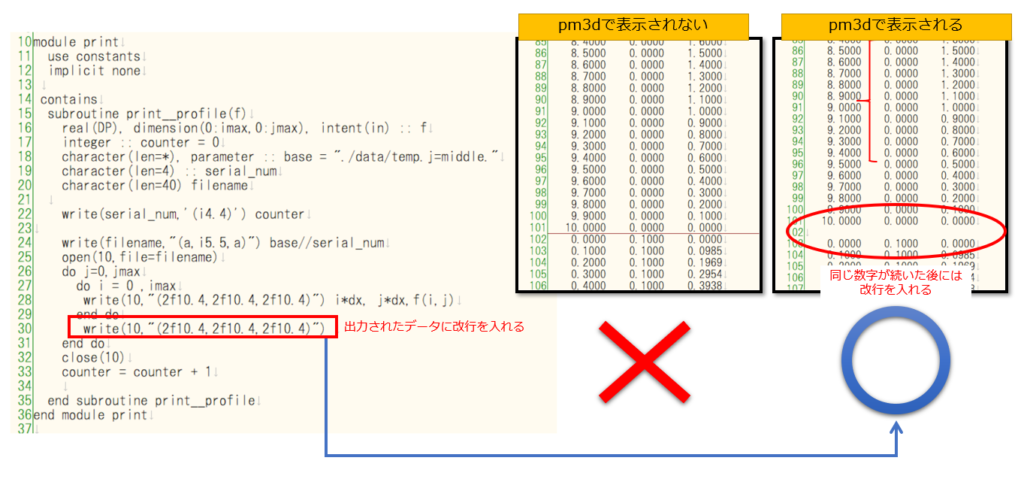
|
1 2 3 4 5 6 7 8 9 10 11 12 13 14 15 16 17 18 19 20 21 22 23 24 25 26 27 28 29 30 31 32 33 34 35 36 37 38 39 40 41 42 43 44 45 46 47 48 49 50 51 52 53 54 55 56 57 58 59 60 61 62 63 64 65 66 67 68 69 70 71 72 73 74 75 76 77 78 79 80 81 82 83 84 85 86 87 88 89 90 91 92 93 |
!ファイル名 2D_Thermal_Eq.f90 module constants implicit none integer::i,j,nt integer, parameter :: imax = 100,jmax=imax,ntmax = 2500 real(8):: T(0:imax,0:jmax),xmax,ymax,x,y,dx,dy,dt,kp integer,parameter :: SP = kind(1.0) integer,parameter :: DP = selected_real_kind(2*precision(1.0_SP)) end module constants module print use constants implicit none contains subroutine print__profile(f) real(DP), dimension(0:imax,0:jmax), intent(in) :: f integer :: counter = 0 character(len=*), parameter :: base = "./data/temp.j=middle." character(len=4) :: serial_num character(len=40) filename write(serial_num,'(i4.4)') counter write(filename,"(a,i5.5,a)") base//serial_num open(10,file=filename) do j=0,jmax do i = 0 ,imax write(10,"(2f10.4,2f10.4,2f10.4)") i*dx, j*dx,f(i,j) end do write(10,"(2f10.4,2f10.4,2f10.4)") end do close(10) counter = counter + 1 end subroutine print__profile end module print program thermal_explicit use constants use print implicit none dt = 0.004 kp = 1 xmax = 10 ymax=xmax dx = xmax/imax dy = ymax/jmax open(10,file="initial.txt") open(11,file="final.txt") !initial state do j=0,jmax do i = 0, imax x = dx*i y = dy*j if (i < imax/2) then T(i,j) = x else T(i,j) = xmax - x endif write(10,*) ,x,y,T(i,j) end do end do call print__profile(T(:,:)) !Time step do nt = 1, ntmax do j=1,jmax-1 do i = 1, imax-1 T(i,j) = T(i,j) + kp*dt/(dx*dx)*(T(i+1,j)- 2*T(i,j) +T(i-1,j)) & + kp*dt/(dy*dx)*(T(i,j+1)- 2*T(i,j) +T(i,j-1)) end do end do if (mod(nt,100)==0) call print__profile(T(:,:)) write(*,*)nt end do !Final state do j=0,jmax do i = 0, imax x = dx*i y = dy*j write(11,*) x,y,T(i,j) end do end do end program thermal_explicit |
↓前回の記事の次元を1次元から2次元に拡張しただけです。
|
1 2 |
gfortran 2D_Thermal_Eq.f90 ./a.out |
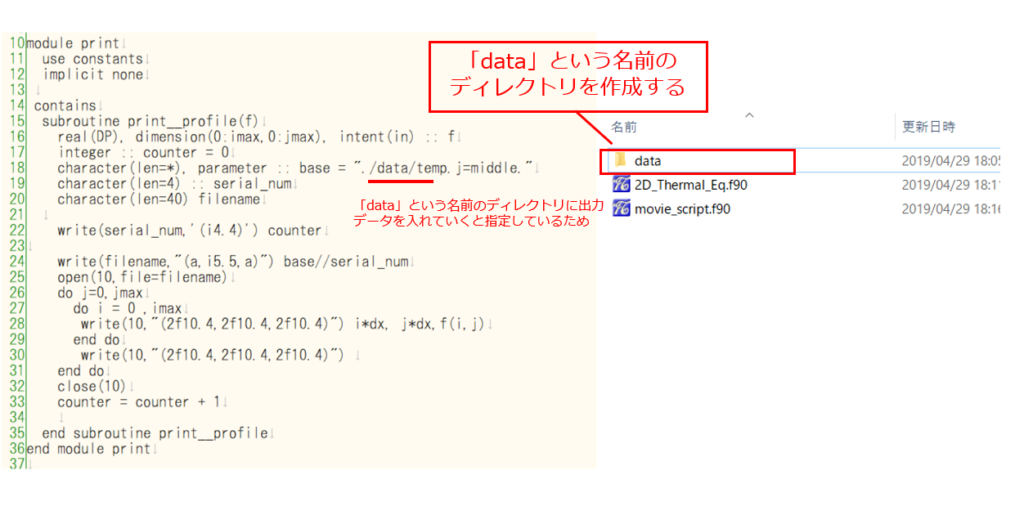
実行ができれば「data」という名前のディレクトリの中に、以下のように大量のデータが保存されていることが確認できます。


これらのデータが指定したタイムステップで出力された温度の空間分布のデータです。
あとは、これらのデータを順番にgnuplotで読み込めばアニメーションが完成ということになります。
そのためには、gnuplotのスクリプトが必要になります。
スクリプトは書くのが少々面倒なので、スクリプト自体をFortranで書くことにします。
アニメーション用のgnuplotのスクリプトをFortranで作成
gnuplotのスクリプトを作成するためのFortranのプログラムがこちらです。
|
1 2 3 4 5 6 7 8 9 10 11 12 13 14 15 16 17 18 19 20 21 22 23 24 25 26 27 28 29 30 31 32 33 34 35 36 37 38 39 |
program animation_script implicit none integer, parameter :: imax = 100,xmax = 10,ymax=xmax integer :: counter, counter_end = 24,dx character(len=*), parameter :: base='./data/temp.j=middle.' character(len=4) :: serial_num dx = xmax/imax print *, "#" print *, "# gnuplot script generated by movie_script.f90" print *, "#" print *, " " print *, "set xlabel 'x' # x-axis" print *, "set ylabel 'y ' # y-axis" print *, "set zlabel 'temperature' # z-axis" print *, "set xrange[0:", xmax, "] # j-grid min & max" print *, "set xrange[0:", ymax, "] # j-grid min & max" print *, "set yrange[0.0:10.0] # temperature min & max" print *, "set grid" print *, "set xlabel font 'Arial,20' " print *, "set ylabel font 'Arial,20' " print *, "set zlabel font 'Arial,20' " print *, "set tics font 'Arial,20'" print *, "set zlabel rotate by 90" do counter = 0 , counter_end write(serial_num,'(i4.4)') counter print *, "splot '"//base//serial_num//"' with pm3d" if ( counter==0) then print *, "pause 2" else print *, "pause 1" end if end do print *, "pause -1" end program animation_script |

|
1 2 |
gfortran movie_script.f90 ./a.out >movie |
「./a.out >movie」とするとmovieというファイルが出来上がり、その中にFortranの「print文」の内容を全て書き出してくれます。
この「movie」というファイルがgnuplotのスクリプトとなります。
以上のことが終えれば、あとはgnuplotで「movie」という名前のスクリプトを走らせるだけです。
アニメーションを作成してみよう(^^)/
「movie」というスクリプトは2通りの方法で実行できます。
方法1


↑このようにコマンドを打っても良いですし、
方法2


↑このように「gnuplot」と打って、「load “movie”」とスクリプトファイルをloadしても良いです。
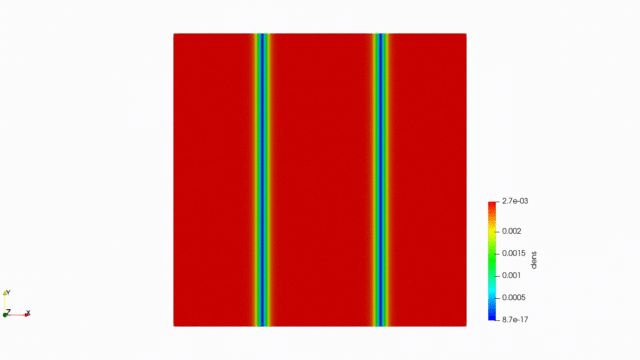
アニメーションはこんな感じ
まとめ
ごちゃごちゃ説明してしまいましたが、下記のzipファイルを解凍して下記のコマンドを打ってお試しください。
|
1 2 3 4 5 |
gfortran 2D_Thermal_Eq.f90 ./a.out gfortran movie_script.f90 ./a.out >movie gnuplot movie |


