こんにちは(@t_kun_kamakiri)
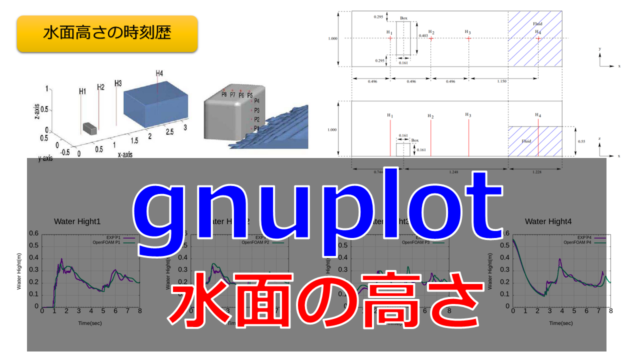
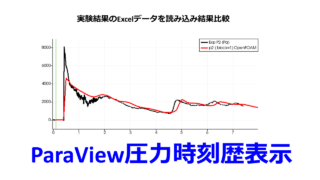
今回は下記の記事で解説した圧力時刻歴データをParaViewとPythonを使って自動化する方法について解説を行います。前回の記事でも圧力の時刻歴データのグラフ化を行いましたが、指定した座標に節点がない場合にデータを出力できないという問題点がありました。
↑こちらの記事で紹介した通り、指定した座標の圧力の時刻歴データはOpenFOAMの設定「system/controlDict」ファイル内でfunctionObjectでprobesを設定することででも出力可能です。
こちらの実験データの圧力計測点と同じ位置の圧力データを取得する設定を行います。
|
1 2 3 4 5 6 7 8 9 10 11 12 13 14 15 16 17 18 19 20 21 22 23 24 25 26 |
/*--------------------------------*- C++ -*----------------------------------*\ ========= | \\ / F ield | OpenFOAM: The Open Source CFD Toolbox \\ / O peration | Version: v2006 \\ / A nd | Website: www.openfoam.com \\/ M anipulation | ------------------------------------------------------------------------------- Description Writes out values of fields from cells nearest to specified locations. \*---------------------------------------------------------------------------*/ #includeEtc "caseDicts/postProcessing/probes/probes.cfg" //probes 設定の挿入 fields (p p_rgh); // プローブする場 probeLocations ( (0.8245001 0 0.0205) // プローブ座標 P1 (0.8245001 0 0.0605) // プローブ座標 P2 (0.8245001 0 0.1005) // プローブ座標 P3 (0.8245001 0 0.1405) // プローブ座標 P4 (0.8040 0 0.161 ) // プローブ座標 P5 (0.7640 0 0.161 ) // プローブ座標 P6 (0.7240 0 0.161 ) // プローブ座標 P7 (0.6840 0 0.161 ) // プローブ座標 P8 ); interpolationScheme cellPoint; // 補間スキーム // ************************************************************************* // |
- 「fields (p p_rgh);」で出力する物理量を指定します。
- probeLocationsで出力したい座標位置を指定します。
- 「interpolationScheme cellPoint」はセル値による線形重み付け補間スキーム
probesをsystem/controlDictで読み込みます。
|
1 2 3 4 5 6 7 8 9 10 11 12 13 14 15 16 17 18 19 20 21 22 23 24 25 26 27 28 29 30 31 32 33 34 35 36 37 38 39 40 41 42 43 44 45 46 47 48 49 50 51 52 53 54 55 56 57 58 59 60 61 62 63 64 65 66 67 |
/*--------------------------------*- C++ -*----------------------------------*\ | ========= | | | \\ / F ield | OpenFOAM: The Open Source CFD Toolbox | | \\ / O peration | Version: v2006 | | \\ / A nd | Website: www.openfoam.com | | \\/ M anipulation | | \*---------------------------------------------------------------------------*/ FoamFile { version 2.0; format ascii; class dictionary; location "system"; object controlDict; } // * * * * * * * * * * * * * * * * * * * * * * * * * * * * * * * * * * * * * // application interFoam; startFrom startTime; startTime 0; stopAt endTime; endTime 8; deltaT 0.001; writeControl adjustable; writeInterval 0.1; purgeWrite 0; writeFormat ascii; writePrecision 6; writeCompression off; timeFormat general; timePrecision 6; runTimeModifiable yes; adjustTimeStep yes; maxCo 0.5; maxAlphaCo 0.5; maxDeltaT 1; functions // 関数定義 { #includeFunc solverInfo(U,p,alpha.water); residuals { type solverInfo; libs ("libutilityFunctionObjects.so"); fields (".*"); } #includeFunc probes; // 壁面での圧力時系列モニター用のプローブ } // ************************************************************************* // |
本来はこちらの設定の方が結果処理の手間が省けて良いのですが、計算実行後に設定し忘れて(もしくは後で見たくなった)などの理由で可視化ソフトで表示させたいということは稀にあります。
3次元ダムブレイクの実験の指定した座標位置での圧力をParaViewで表示する方法について解説を行います。
OpenFOAM初心者でチュートリアルを動かしたことがある方を対象にしています。
DEXCS2020
OpenFOAM v2006
gnuplot 5.2
3次元ダムブレイクの実験データと解析モデル
実験データ
こちらの実験データのより以下の時刻歴データを計測しています。
- 圧力計測点P1~P8←今回OpenFOAMと比較する対象
- 水面の高さH1~H4

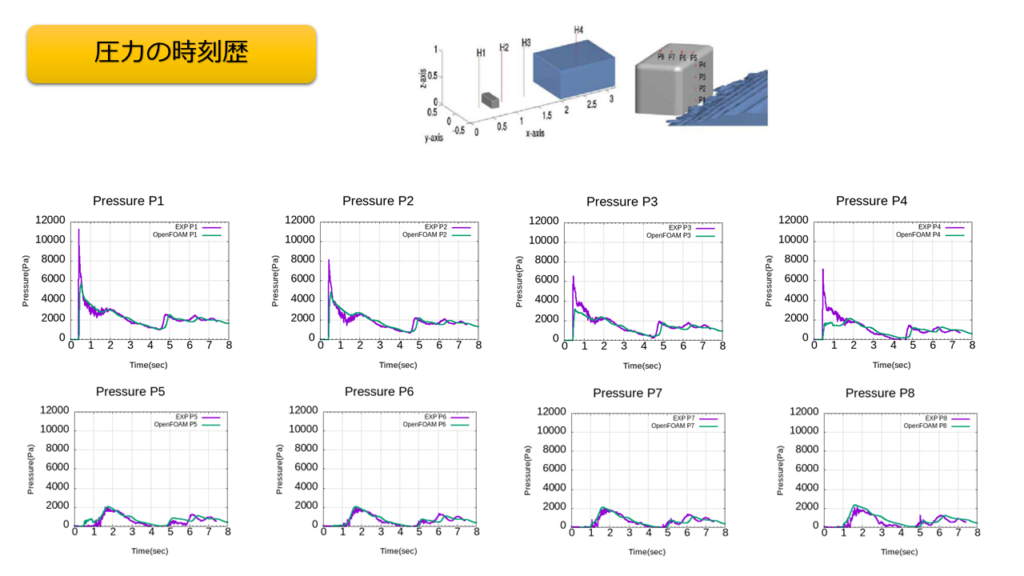

そこそこ実験とOpenFOAMの結果が合っていますね。
解析モデル
OpenFOAMでの解析モデルの設定方法は下記の記事に書いています。
※追々ファイルもモデルファイルも公開します。
ParaViewで圧力の時刻歴表示
操作方法はこちらに記載しています。
今回は自動化をさせたいのでPythonスクリプトに操作を記録しています。
ただし、この資料内ではP1の座標のみのデータを取得しています。
最終的には「probe_main_Alltime.py」には以下の記述がされています。
|
1 2 3 4 5 6 7 8 9 10 11 12 13 14 15 16 17 18 19 20 21 22 23 24 25 26 27 28 29 30 31 32 33 34 35 36 37 38 39 40 41 42 43 44 45 46 47 48 49 50 51 52 53 54 55 56 57 58 59 60 61 62 63 64 65 66 67 68 69 70 71 72 73 74 75 76 77 78 79 80 81 82 83 84 85 86 87 88 89 90 91 92 93 94 95 96 97 98 99 100 101 102 103 104 105 106 107 108 109 110 111 112 113 114 115 116 117 118 119 |
# trace generated using paraview version 5.6.3 # # To ensure correct image size when batch processing, please search # for and uncomment the line `# renderView*.ViewSize = [*,*]` #### import the simple module from the paraview from paraview.simple import * #### disable automatic camera reset on 'Show' paraview.simple._DisableFirstRenderCameraReset() # create a new 'OpenFOAMReader' postfoam = OpenFOAMReader(FileName='/home/kamakiri/Desktop/OpenFOAM/damBreak_snappyHexMesh_less_less_blog/post.foam') # get animation scene animationScene1 = GetAnimationScene() # update animation scene based on data timesteps animationScene1.UpdateAnimationUsingDataTimeSteps() # get active view renderView1 = GetActiveViewOrCreate('RenderView') # uncomment following to set a specific view size # renderView1.ViewSize = [1162, 682] # show data in view postfoamDisplay = Show(postfoam, renderView1) # trace defaults for the display properties. postfoamDisplay.Representation = 'Surface' # reset view to fit data renderView1.ResetCamera() # show color bar/color legend postfoamDisplay.SetScalarBarVisibility(renderView1, True) # update the view to ensure updated data information renderView1.Update() # get color transfer function/color map for 'p' pLUT = GetColorTransferFunction('p') # get opacity transfer function/opacity map for 'p' pPWF = GetOpacityTransferFunction('p') # reset view to fit data renderView1.ResetCamera() # create a new 'Slice' slice1 = Slice(Input=postfoam) # toggle 3D widget visibility (only when running from the GUI) Hide3DWidgets(proxy=slice1.SliceType) # Properties modified on slice1.SliceType slice1.SliceType.Normal = [0.0, 1.0, 0.0] # Properties modified on slice1.SliceType slice1.SliceType.Normal = [0.0, 1.0, 0.0] # show data in view slice1Display = Show(slice1, renderView1) # trace defaults for the display properties. slice1Display.Representation = 'Surface' # hide data in view Hide(postfoam, renderView1) # show color bar/color legend slice1Display.SetScalarBarVisibility(renderView1, True) # update the view to ensure updated data information renderView1.Update() # create a new 'Probe Location' probeLocation1 = ProbeLocation(Input=slice1, ProbeType='Fixed Radius Point Source') # Properties modified on probeLocation1.ProbeType probeLocation1.ProbeType.Center = [0.8245001, 0.0, 0.0205] # Create a new 'SpreadSheet View' spreadSheetView1 = CreateView('SpreadSheetView') spreadSheetView1.ColumnToSort = '' spreadSheetView1.BlockSize = 1024L # uncomment following to set a specific view size # spreadSheetView1.ViewSize = [400, 400] # get layout layout1 = GetLayout() # place view in the layout layout1.AssignView(2, spreadSheetView1) # show data in view probeLocation1Display = Show(probeLocation1, spreadSheetView1) # update the view to ensure updated data information renderView1.Update() # update the view to ensure updated data information spreadSheetView1.Update() # export view export_heigth = '/home/kamakiri/Desktop/OpenFOAM/damBreak_snappyHexMesh_less_less_blog/paraview_post/test.csv' ExportView(export_heigth, view=spreadSheetView1) #### saving camera placements for all active views # current camera placement for renderView1 renderView1.CameraPosition = [1.6100000143051147, -6.794078149091664, 0.5] renderView1.CameraFocalPoint = [1.6100000143051147, 0.0, 0.5] renderView1.CameraViewUp = [0.0, 0.0, 1.0] renderView1.CameraParallelScale = 1.758436818899806 #### uncomment the following to render all views # RenderAllViews() # alternatively, if you want to write images, you can use SaveScreenshot(...). |
ターミナル上で以下のコマンドを打つことでPythonスクリプトを実行することができます。
|
1 |
pvpython probe_main_Alltime.py |
今回はP1座標の結果のみを取得しましたが、以下でprobe_main_Alltime.pyの中身を編集してP1~P8の座標のデータを自動で取得するプログラムにします。
Pythonスクリプトの編集
P1~P8の座標の圧力の取得するプログラムに編集したのがこちらです。
|
1 2 3 4 5 6 7 8 9 10 11 12 13 14 15 16 17 18 19 20 21 22 23 24 25 26 27 28 29 30 31 32 33 34 35 36 37 38 39 40 41 42 43 44 45 46 47 48 49 50 51 52 53 54 55 56 57 58 59 60 61 62 63 64 65 66 67 68 69 70 71 72 73 74 75 76 77 78 79 80 81 82 83 84 85 86 87 88 89 90 91 92 93 94 95 96 97 98 99 100 101 102 103 104 105 106 107 108 109 110 111 112 113 114 115 116 117 118 119 120 121 122 123 124 125 126 127 128 129 130 131 132 133 134 135 136 |
# trace generated using paraview version 5.6.3 # # To ensure correct image size when batch processing, please search # for and uncomment the line `# renderView*.ViewSize = [*,*]` #### import the simple module from the paraview from paraview.simple import * #### disable automatic camera reset on 'Show' paraview.simple._DisableFirstRenderCameraReset() # create a new 'OpenFOAMReader' postfoam = OpenFOAMReader(FileName='/home/kamakiri/Desktop/OpenFOAM/damBreak_snappyHexMesh_less_less_blog/post.foam') probe_points = { 'p1':[0.8245001, 0.0, 0.0205], 'p2':[0.8245001, 0.0, 0.0605], 'p3':[0.8245001, 0.0, 0.1005], 'p4':[0.8245001, 0.0, 0.1405], 'p5':[0.8040 , 0.0, 0.161], 'p6':[0.7640 , 0.0, 0.161], 'p7':[0.7240 , 0.0, 0.161], 'p8':[0.6840, 0.0, 0.161] } for point in probe_points: probe = probe_points[point] # get animation scene animationScene1 = GetAnimationScene() # update animation scene based on data timesteps animationScene1.UpdateAnimationUsingDataTimeSteps() # get active view renderView1 = GetActiveViewOrCreate('RenderView') # uncomment following to set a specific view size # renderView1.ViewSize = [1162, 682] # show data in view postfoamDisplay = Show(postfoam, renderView1) # trace defaults for the display properties. postfoamDisplay.Representation = 'Surface' # reset view to fit data renderView1.ResetCamera() # show color bar/color legend postfoamDisplay.SetScalarBarVisibility(renderView1, True) # update the view to ensure updated data information renderView1.Update() # get color transfer function/color map for 'p' pLUT = GetColorTransferFunction('p') # get opacity transfer function/opacity map for 'p' pPWF = GetOpacityTransferFunction('p') # reset view to fit data renderView1.ResetCamera() # reset view to fit data renderView1.ResetCamera() # create a new 'Slice' slice1 = Slice(Input=postfoam) # toggle 3D widget visibility (only when running from the GUI) Hide3DWidgets(proxy=slice1.SliceType) # Properties modified on slice1.SliceType slice1.SliceType.Normal = [0.0, 1.0, 0.0] # Properties modified on slice1.SliceType slice1.SliceType.Normal = [0.0, 1.0, 0.0] # show data in view slice1Display = Show(slice1, renderView1) # trace defaults for the display properties. slice1Display.Representation = 'Surface' # hide data in view Hide(postfoam, renderView1) # show color bar/color legend slice1Display.SetScalarBarVisibility(renderView1, True) # update the view to ensure updated data information renderView1.Update() # create a new 'Probe Location' probeLocation1 = ProbeLocation(Input=slice1, ProbeType='Fixed Radius Point Source') # Properties modified on probeLocation1.ProbeType probeLocation1.ProbeType.Center = probe # Create a new 'SpreadSheet View' spreadSheetView1 = CreateView('SpreadSheetView') spreadSheetView1.ColumnToSort = '' spreadSheetView1.BlockSize = 1024L # uncomment following to set a specific view size # spreadSheetView1.ViewSize = [400, 400] # get layout layout1 = GetLayout() # place view in the layout layout1.AssignView(2, spreadSheetView1) # show data in view probeLocation1Display = Show(probeLocation1, spreadSheetView1) # update the view to ensure updated data information renderView1.Update() # update the view to ensure updated data information spreadSheetView1.Update() # save data export_heigth = '/home/kamakiri/Desktop/OpenFOAM/damBreak_snappyHexMesh_less_less_blog/paraview_post/probe/'+ point + '.csv' SaveData(export_heigth, proxy=probeLocation1, WriteTimeSteps=1) #### saving camera placements for all active views # current camera placement for renderView1 renderView1.CameraPosition = [1.6100000143051147, -6.794078149091664, 0.5] renderView1.CameraFocalPoint = [1.6100000143051147, 0.0, 0.5] renderView1.CameraViewUp = [0.0, 0.0, 1.0] renderView1.CameraParallelScale = 1.758436818899806 #### uncomment the following to render all views # RenderAllViews() # alternatively, if you want to write images, you can use SaveScreenshot(...). |
まずP1~p8の座標を辞書型で定義しました。
|
1 2 3 4 5 6 7 8 9 10 |
probe_points = { 'p1':[0.8245001, 0.0, 0.0205], 'p2':[0.8245001, 0.0, 0.0605], 'p3':[0.8245001, 0.0, 0.1005], 'p4':[0.8245001, 0.0, 0.1405], 'p5':[0.8040 , 0.0, 0.161], 'p6':[0.7640 , 0.0, 0.161], 'p7':[0.7240 , 0.0, 0.161], 'p8':[0.6840, 0.0, 0.161] } |
そしてその辞書型をfor文で繰り返しています。
probe_points[point]とすることでpointにキーが格納され(p1~p8)、probe_points[point]がキーに対応する値(座標)になります。
probeLocation1.ProbeType.Center = probeで座標を代入しています。
|
1 2 3 4 5 6 |
for point in probe_points: probe = probe_points[point] (省略) # Properties modified on probeLocation1.ProbeType probeLocation1.ProbeType.Center = probe |
以下の部分で位置を区別したcsvファイルを出力しています。
|
1 2 3 |
# save data export_heigth = '/home/kamakiri/Desktop/OpenFOAM/damBreak_snappyHexMesh_less_less_blog/paraview_post/probe/'+ point + '.csv' SaveData(export_heigth, proxy=probeLocation1, WriteTimeSteps=1) |
pvpythonはバージョン2.7なので、最新のPythonのバージョン3系とは書き方が異なることに注意する必要があります。
これでもう一度はターミナル上で以下のコマンドを打ちます。
|
1 |
pvpython probe_main_Alltime.py |
このように「p*.csv」がずらっと出ていればOKです。
p1~p8の座標の1~8秒までのステップ(0.1秒刻み)で出力しています。
Pythonでデータを繋げる
「p1.0.csv」の中身を見ると以下のようにp1座標の0ステップ目(0秒)での物理量が入っているだけです。


これをPythonを使って各ステップのデータを繋げる作業が必要です。
jupyter labを使ってデータを繋げます。
※ここでのPythonは3系です。
まとめると以下のようになります。
|
1 2 3 4 5 6 7 8 9 10 11 12 13 14 15 16 17 18 19 20 21 22 23 24 25 26 27 28 29 30 31 32 33 34 35 36 37 38 39 40 41 42 43 44 45 46 47 48 49 50 51 52 53 54 55 56 57 58 |
import pandas as pd import glob import re import matplotlib.pyplot as plt import subprocess def atoi(text): return int(text) if text.isdigit() else text def natural_keys(text): return [ atoi(c) for c in re.split(r'(\d+)', text) ] def probe_func(i, point): list_csv = glob.glob(f'{point}*.csv') list_csv_sort = sorted(list_csv, key=natural_keys) df = pd.DataFrame() for csv_file in list_csv_sort: df_ = pd.read_csv(csv_file) df_['time'] = float(re.findall(r"\d+", csv_file)[1])/10.0 df = pd.concat([df,df_]) ax = fig.add_subplot(4, 4, i+1) ax.plot(df_exp['Time (s)'], df_exp[f'{point.upper()} (Pa)'], color='black',label='Exp data') ax.plot(df['time'], df['p'], color='red', label='OpenFOAM ParaView') ax.set_xlabel('x(m)') ax.set_ylabel('Pressure(Pa)') ax.set_title(f'{point}') ax.set_xlim(0, 8) ax.set_ylim(0,10000) ax.grid() ax.legend() if __name__ == '__main__': # 指定した座標 probe_points = { 'p1':[0.8245001, 0.0, 0.0205], 'p2':[0.8245001, 0.0, 0.0605], 'p3':[0.8245001, 0.0, 0.1005], 'p4':[0.8245001, 0.0, 0.1405], 'p5':[0.8040 , 0.0, 0.161], 'p6':[0.7640 , 0.0, 0.161], 'p7':[0.7240 , 0.0, 0.161], 'p8':[0.6840, 0.0, 0.161] } df_exp = pd.read_csv('../../exp_data/3D_damBrake_experiment_data/9449af_6ce73873d6d04315853e481c337dbfca/test_case_2_exp_data.csv',sep='\t' ) #subprocess.run(['pvpython','probe_main_Alltime.py']) fig = plt.figure(figsize=(20,16)) plt.subplots_adjust(wspace=0.4, hspace=0.6) for i, point in enumerate(probe_points): probe_func(i, point) fig.savefig("point.jpg") |
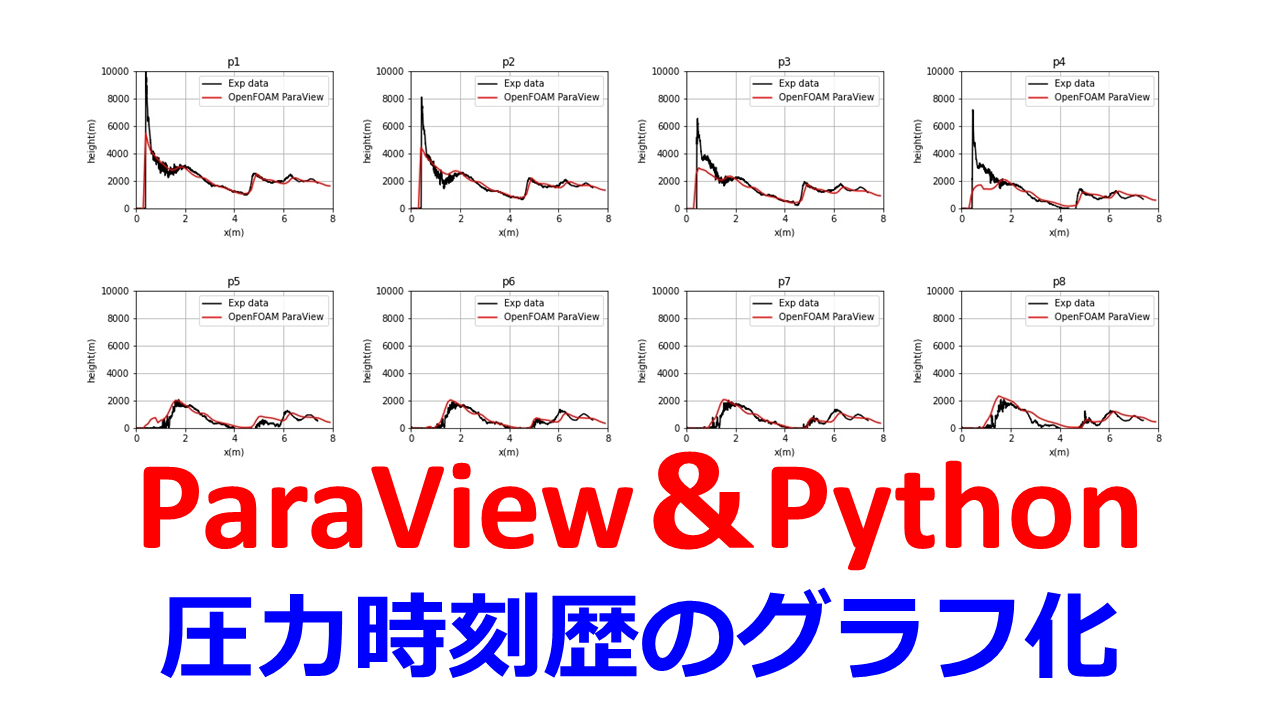
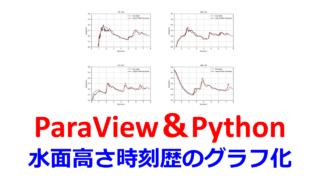
こちらを実行すると「point.jpg」という画像ファイルが出力されます。
画像の余白など修正が必要ですが、今はあまりこだわらずにいます。
ParaViewとPythonだけでも色々できるということがわかった。 pic.twitter.com/ieZIKoQWtD
— カマキリ🐲Python頑張る昆虫 (@t_kun_kamakiri) June 19, 2022
#subprocess.run([‘pvpython’,’probe_main_Alltime.py’])のコメントアウトを外すと、「pvpython probe_main_Alltime.py」が実行されてp1~p8の各ステップの物理量のcsvファイルが出力されます。
はじめてcsvファイルを出力する場合はこちらを使えば良いです。
まとめ
今回は圧力時刻歴データをParaViewとPythonを使って自動化する方法について解説を行いました。計算を実行した後にどうしてもデータが欲しいという場合は、ParaViewとPythonを使うことでデータ処理を行うことができます。
今回はPythonを使いましたが、理由はPythonが簡単で慣れているからであることと、ParaViewのマクロがPythonで記述されているのでその延長でPythonのみを使いました。グラフ化の部分はgnuplotを使ってもいいですし、その他の言語や有料のソフトを使っても良いでしょう。
参考書
PENGUINさんサイトを体系的に学べる書籍となっています。ネット記事でも十分勉強できるのですが、OpenFOAMの初学者でOpenFOAMをインストール済みであれば一冊持って置き、体系的に学ぶのが良いでしょう。
あとは初心者向けに丁寧に解説がされているこちらの書籍もお勧めです。最後の章にはオーバーセットメッシュ(重合メッシュ)の機能を使った解析を最後まで丁寧に解説しているので挫折することはないでしょう。
