こんにちは(@t_kun_kamakiri)
今回は下記の記事で解説した水面高さをParaViewで表示し、Pythonで実験データとする方法について解説を行います。
ちなみに、水面高さは「system/controlDict」ファイル内でfunctionObjectのinterfaceHeightで特定座標の水位や波高を取得することが可能です。
1 2 3 4 5 6 7 8 9 10 11 12 13 14 15 16 17 18 19 20 21 22 23 24 25 26 27 28 29 30 31 32 33 34 35 36 37 38 39 40 41 42 43 44 45 46 47 48 49 50 51 52 53 54 55 56 57 58 59 60 61 62 63 64 65 66 67 68 69 70 71 72 73 74 75 76 77 78 79 80 81 82 83 84 85 86 87 88 89 90 91 92 93 94 95 96 97 98 99 100 101 102 | /*--------------------------------*- C++ -*----------------------------------*\ | ========= | | | \\ / F ield | OpenFOAM: The Open Source CFD Toolbox | | \\ / O peration | Version: v2006 | | \\ / A nd | Website: www.openfoam.com | | \\/ M anipulation | | \*---------------------------------------------------------------------------*/ FoamFile { version 2.0; format ascii; class dictionary; location "system"; object controlDict; } // * * * * * * * * * * * * * * * * * * * * * * * * * * * * * * * * * * * * * // application interFoam; startFrom startTime; startTime 0; stopAt endTime; endTime 8; deltaT 0.001; writeControl adjustable; writeInterval 0.1; purgeWrite 0; writeFormat ascii; writePrecision 6; writeCompression off; timeFormat general; timePrecision 6; runTimeModifiable yes; adjustTimeStep yes; maxCo 0.5; maxAlphaCo 0.5; maxDeltaT 1; functions // 関数定義 { #includeFunc solverInfo(U,p,alpha.water); residuals { type solverInfo; libs ("libutilityFunctionObjects.so"); fields (".*"); } #includeFunc probes; // 壁面での圧力時系列モニター用のプローブ interfaceHeight1 { // Mandatory entries (unmodifiable) type interfaceHeight; //libs (“libfieldFunctionObjects.so”); libs (fieldFunctionObjects); // Mandatory entries (runtime modifiable) locations ( (0.496 0 0) (0.992 0 0) (1.488 0 0) (2.638 0 0) ); // Optional entries (runtime modifiable) alpha alpha.water; liquid true; direction (0 0 -1); interpolationScheme cellPoint; // Optional (inherited) entries writePrecision 8; writeToFile true; useUserTime true; region region0; enabled true; log true; timeStart 0; timeEnd 1000; executeControl timeStep; executeInterval 1; writeControl timeStep; writeInterval 1; } } // ************************************************************************* // |
「direction (0 0 -1);」は重力の方向を正しく指定する必要があります。
今回はz方向下向きに重力がはたらいているためこのような設定としました。
また、「postProcessing/interfaceHeight1/0/height.dat」には一つの座標に対して以下の出力結果が出されます。
- # hB : Interface height above the boundary:水面の高さ
- # hL : Interface height above the location:波の高さ
いずれも重力の方向を正しく指定することが重要です。
本来はこちらの設定の方が結果処理の手間が省けて良いのですが、計算実行後に設定し忘れて(もしくは後で見たくなった)などの理由で可視化ソフトで表示させたいということは稀にあります。
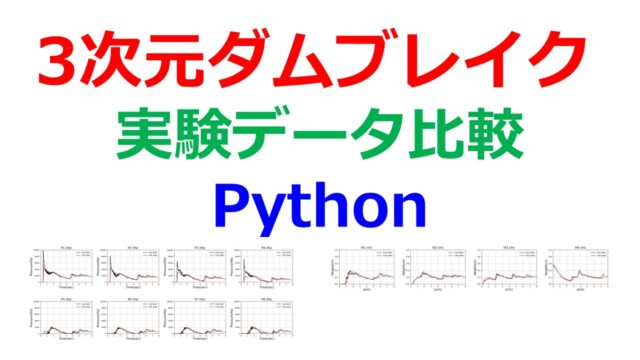
3次元ダムブレイクの実験の指定した座標位置での水面高さをParaViewで表示し、Pythonで実験データと比較する方法について解説を行います。
OpenFOAM初心者でチュートリアルを動かしたことがある方を対象にしています。
DEXCS2020
OpenFOAM v2006
gnuplot 5.2
3次元ダムブレイクの実験データと解析モデル
実験データ
こちらの実験データのより以下の時刻歴データを計測しています。
- 圧力計測点P1~P8(前回の記事)
- 水面の高さH1~H4←今回OpenFOAMと比較する対象
実験ではx方向に
- H1=0.496m
- H2=0.992m
- H3=1.488m
- H4=2.638m
のポイントで水面高さを出力しています。

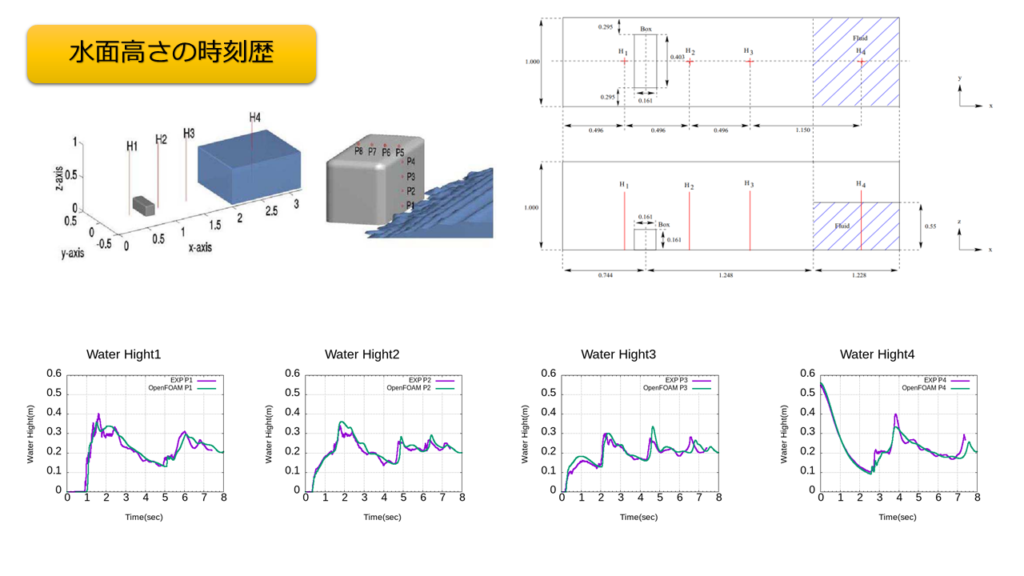
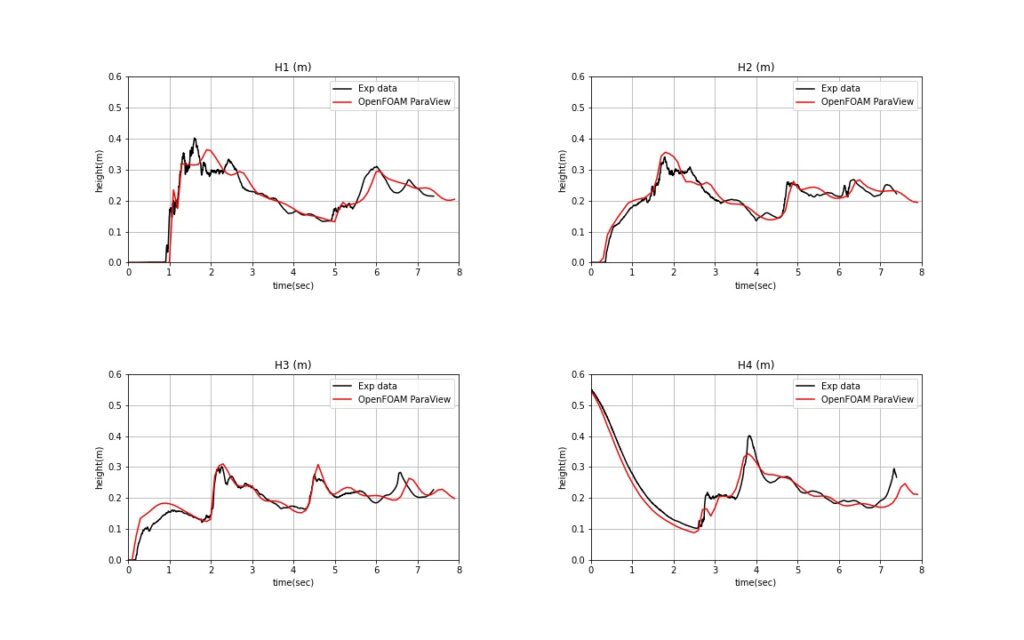
そこそこ実験とOpenFOAMの結果が合っていますね。
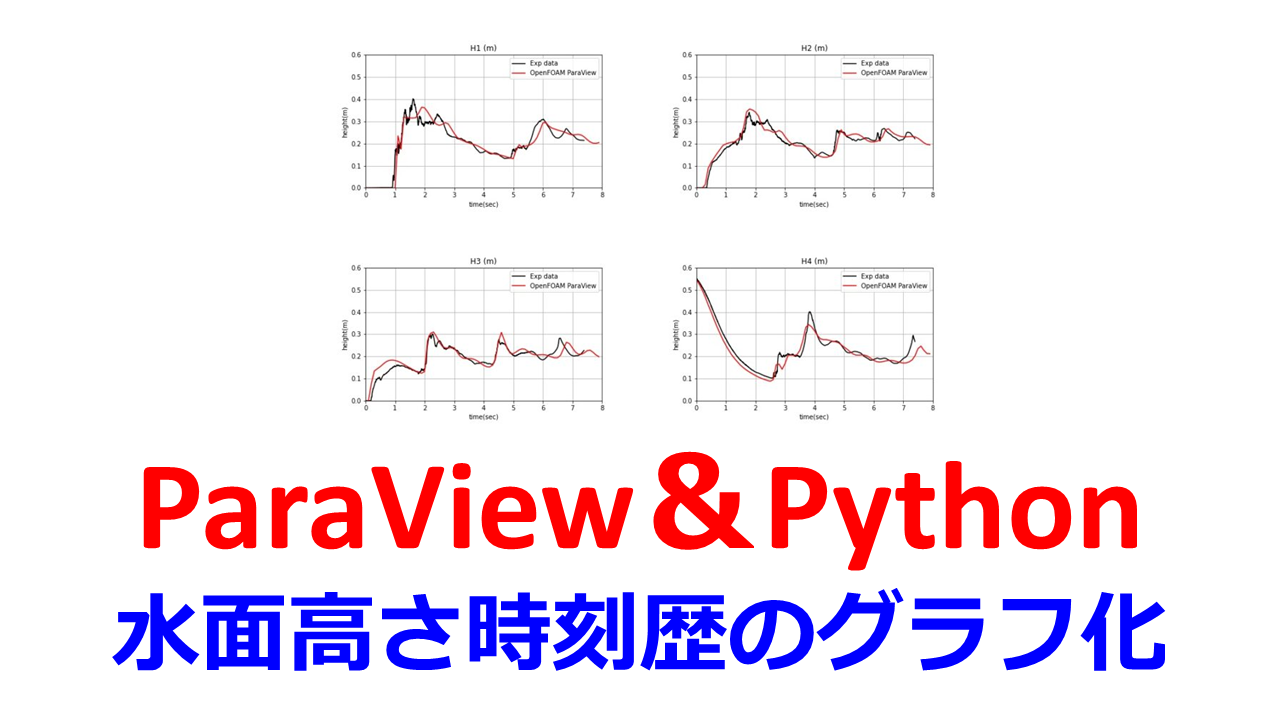
今回はこれをParaViewとPythonを使ってグラフ化をします。
解析モデル
OpenFOAMでの解析モデルの設定方法は下記の記事に書いています。
※追々ファイルもモデルファイルも公開します。
ParaViewで水面高さのコンター図
ParaViewを起動したら資料に従ってParaviewの操作を行います。
「(13)「Export SpreadSheet」を選択」以降は行わず、左上の「File>Save Data」でcsvで保存します。「OK」を押すと、「Configure Writer(DataSetCSVWriter)」と出るので、「Write Time Steps」にチェックを入れて「OK」を押します。
するとこのように「height0.ステップ数.csv」で全てのステップ数のデータが保存されます。

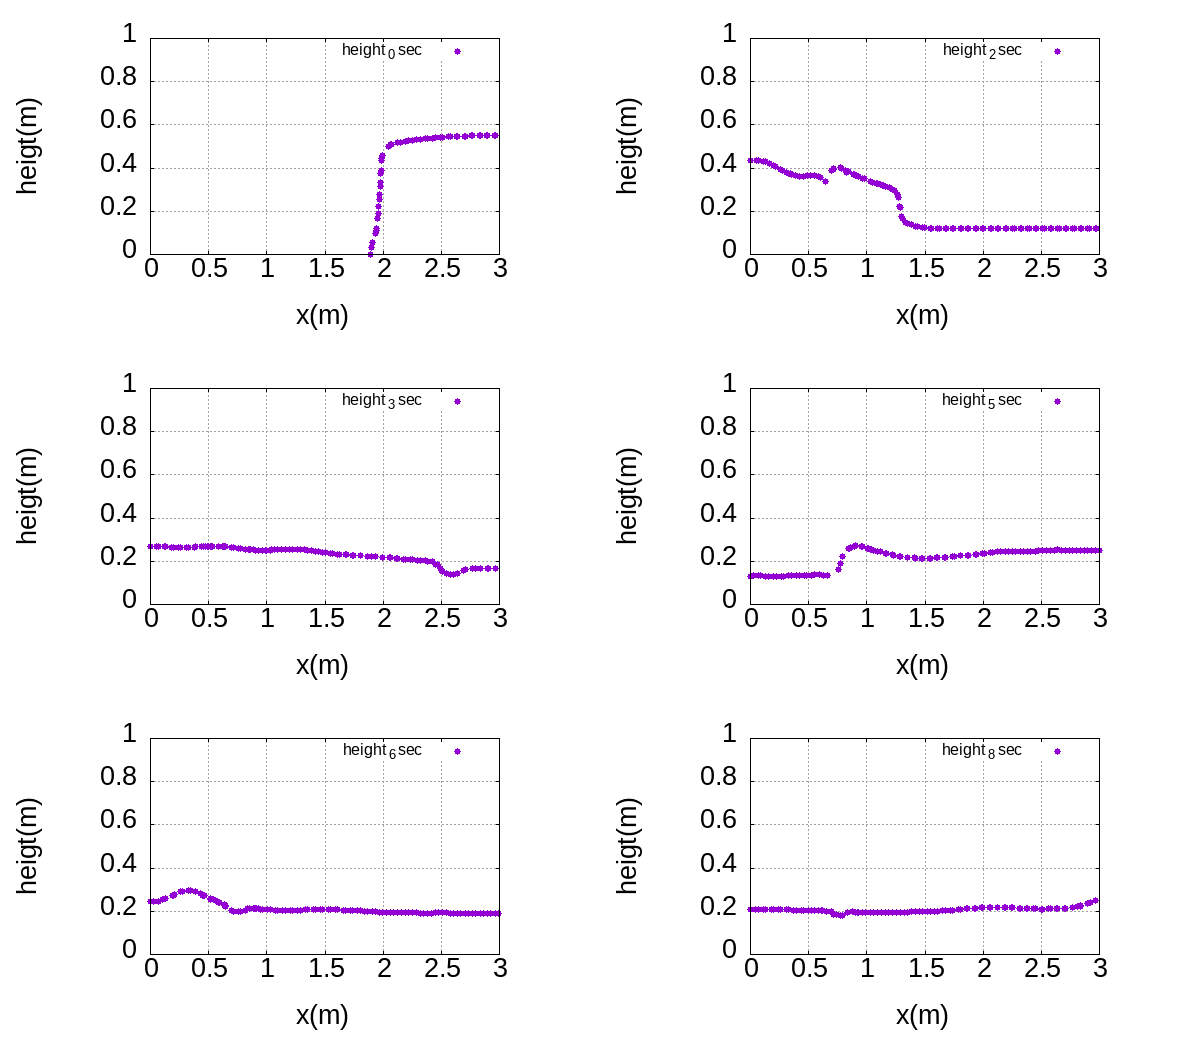
「Points:0」が横軸、「Points:2」が体積分率0.5の高さを表しているので、グラフにすると以下のように水面高さの分布になります。

Pythonでデータの加工
以上で各ステップの体積分率0.5(水面高さに相当する量)のデータがそろったので、指定した座標での水面高さの時刻歴をPythonでグラフ化したいと思います。
jupyter lab(Python3系)でデータを加工します。
コードをまとめると以下のようになります。
1 2 3 4 5 6 7 8 9 10 11 12 13 14 15 16 17 18 19 20 21 22 23 24 25 26 27 28 29 30 31 32 33 34 35 36 37 38 39 40 41 42 43 44 45 46 47 48 49 50 51 52 53 54 55 56 57 58 59 60 61 | import matplotlib.pyplot as plt import math import re import pandas as pd # read csv file def df_csv(csvfile): df = pd.read_csv(csvfile) return df # csvファイルのファイル名のソート def atoi(text): return int(text) if text.isdigit() else text def natural_keys(text): return [ atoi(c) for c in re.split(r'(\d+)', text) ] csvfile_sort = sorted(csv_file, key=natural_keys) delta = 0.03 height_list = [] # 時刻歴データをつなげる for csvfile in csvfile_sort: height_dict = {} height_dict['time(sec)'] = float(re.findall(r"\d+", csvfile)[1])/10 df_h = pd.DataFrame() df = df_csv(csvfile) for point in Hxpoints: Hz_mean = df[(df['Points:0']>=Hxpoints[point]-delta) & (df['Points:0']<=Hxpoints[point]+delta)]['Points:2'].mean() if math.isnan(Hz_mean) == True: # nan height_dict[point] = 0.0 else: height_dict[point] = Hz_mean height_list.append(height_dict) df_h_ = pd.DataFrame(height_list) df_h = pd.concat([df_h, df_h_]) # グラフ化(OpenFOAMと実験の比較) fig = plt.figure(figsize=(16,10)) plt.subplots_adjust(wspace=0.4, hspace=0.6) df_exp = pd.read_csv('../../exp_data/3D_damBrake_experiment_data/9449af_6ce73873d6d04315853e481c337dbfca/test_case_2_exp_data.csv',sep='\t' ) for i, point in enumerate(Hxpoints): ax = fig.add_subplot(2, 2, i+1) ax.plot(df_exp['Time (s)'], df_exp[f'{point}'], color='black',label='Exp data') ax.plot(df_h['time(sec)'], df_h[point], color='red', label='OpenFOAM ParaView') ax.set_xlabel('time(sec)') ax.set_ylabel('height(m)') ax.set_title(f'{point}') ax.set_xlim(0, 8.0) ax.set_ylim(0,0.6) ax.grid() ax.legend() fig.savefig("Height.jpg") |
水面高さの時刻歴をグラフ化できました。
まとめ
今回はParaviewで水面高さの時刻歴のグラフ化をParaViewとPythonで出力する方法を解説しました。
計算実行後に、データの分析したい場合はデータ加工が必要ですがParaViewとPythonで十分行えることがわかりました。
参考書
PENGUINさんサイトを体系的に学べる書籍となっています。ネット記事でも十分勉強できるのですが、OpenFOAMの初学者でOpenFOAMをインストール済みであれば一冊持って置き、体系的に学ぶのが良いでしょう。
あとは初心者向けに丁寧に解説がされているこちらの書籍もお勧めです。最後の章にはオーバーセットメッシュ(重合メッシュ)の機能を使った解析を最後まで丁寧に解説しているので挫折することはないでしょう。
