こんにちは(@t_kun_kamakiri)
今回は下記の記事で解説した水面高さをParaViewで表示する方法について解説を行います。
ちなみに、水面高さは「system/controlDict」ファイル内でfunctionObjectのinterfaceHeightで特定座標の水位や波高を取得することが可能です。
|
1 2 3 4 5 6 7 8 9 10 11 12 13 14 15 16 17 18 19 20 21 22 23 24 25 26 27 28 29 30 31 32 33 34 35 36 37 38 39 40 41 42 43 44 45 46 47 48 49 50 51 52 53 54 55 56 57 58 59 60 61 62 63 64 65 66 67 68 69 70 71 72 73 74 75 76 77 78 79 80 81 82 83 84 85 86 87 88 89 90 91 92 93 94 95 96 97 98 99 100 101 102 |
/*--------------------------------*- C++ -*----------------------------------*\ | ========= | | | \\ / F ield | OpenFOAM: The Open Source CFD Toolbox | | \\ / O peration | Version: v2006 | | \\ / A nd | Website: www.openfoam.com | | \\/ M anipulation | | \*---------------------------------------------------------------------------*/ FoamFile { version 2.0; format ascii; class dictionary; location "system"; object controlDict; } // * * * * * * * * * * * * * * * * * * * * * * * * * * * * * * * * * * * * * // application interFoam; startFrom startTime; startTime 0; stopAt endTime; endTime 8; deltaT 0.001; writeControl adjustable; writeInterval 0.1; purgeWrite 0; writeFormat ascii; writePrecision 6; writeCompression off; timeFormat general; timePrecision 6; runTimeModifiable yes; adjustTimeStep yes; maxCo 0.5; maxAlphaCo 0.5; maxDeltaT 1; functions // 関数定義 { #includeFunc solverInfo(U,p,alpha.water); residuals { type solverInfo; libs ("libutilityFunctionObjects.so"); fields (".*"); } #includeFunc probes; // 壁面での圧力時系列モニター用のプローブ interfaceHeight1 { // Mandatory entries (unmodifiable) type interfaceHeight; //libs (“libfieldFunctionObjects.so”); libs (fieldFunctionObjects); // Mandatory entries (runtime modifiable) locations ( (0.496 0 0) (0.992 0 0) (1.488 0 0) (2.638 0 0) ); // Optional entries (runtime modifiable) alpha alpha.water; liquid true; direction (0 0 -1); interpolationScheme cellPoint; // Optional (inherited) entries writePrecision 8; writeToFile true; useUserTime true; region region0; enabled true; log true; timeStart 0; timeEnd 1000; executeControl timeStep; executeInterval 1; writeControl timeStep; writeInterval 1; } } // ************************************************************************* // |
「direction (0 0 -1);」は重力の方向を正しく指定する必要があります。
今回はz方向下向きに重力がはたらいているためこのような設定としました。
また、「postProcessing/interfaceHeight1/0/height.dat」には一つの座標に対して以下の出力結果が出されます。
- # hB : Interface height above the boundary:水面の高さ
- # hL : Interface height above the location:波の高さ
いずれも重力の方向を正しく指定することが重要です。
本来はこちらの設定の方が結果処理の手間が省けて良いのですが、計算実行後に設定し忘れて(もしくは後で見たくなった)などの理由で可視化ソフトで表示させたいということは稀にあります。
3次元ダムブレイクの実験の指定した座標位置での水面高さをParaViewで表示し、Pythonスクリプトにして自動化する方法について解説を行います。
OpenFOAM初心者でチュートリアルを動かしたことがある方を対象にしています。
DEXCS2020
OpenFOAM v2006
gnuplot 5.2
3次元ダムブレイクの実験データと解析モデル
実験データ
こちらの実験データのより以下の時刻歴データを計測しています。
- 圧力計測点P1~P8(前回の記事)
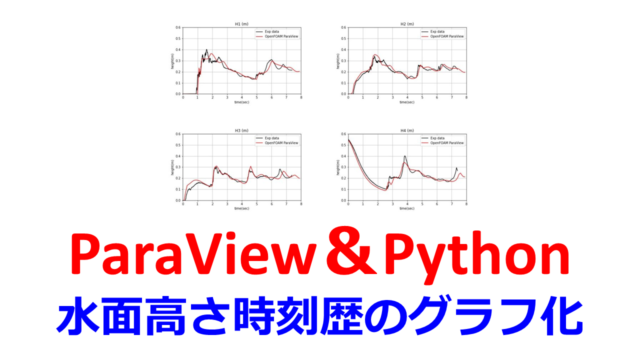
- 水面の高さH1~H4←今回OpenFOAMと比較する対象

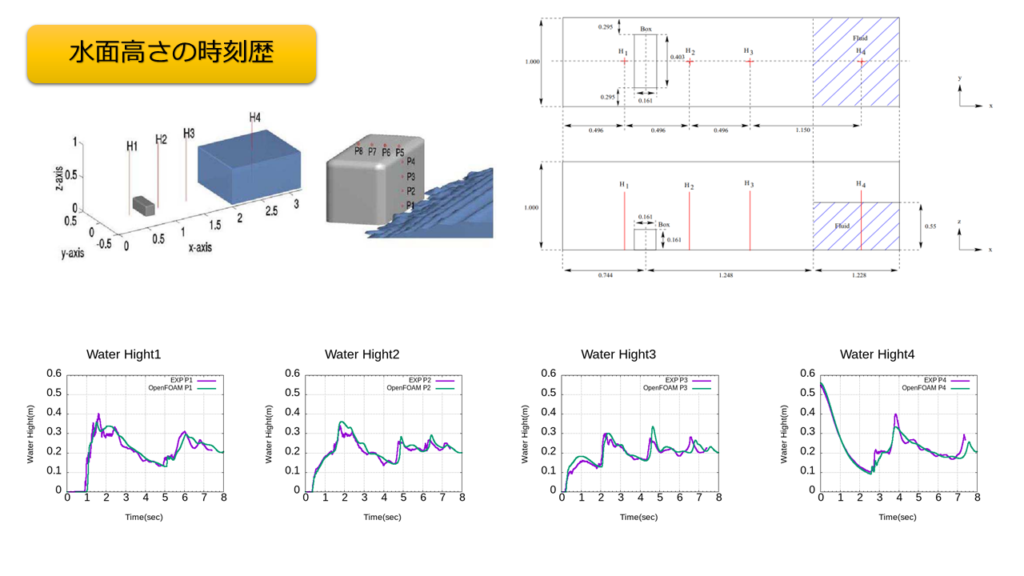

そこそこ実験とOpenFOAMの結果が合っていますね。
解析モデル
OpenFOAMでの解析モデルの設定方法は下記の記事に書いています。
※追々ファイルもモデルファイルも公開します。
ParaViewで水面高さのコンター図
ParaViewを起動したら資料に従ってParaviewの操作を記録していきます。
操作が記録されて出力されたPythonスクリプトがこちらです。
|
1 2 3 4 5 6 7 8 9 10 11 12 13 14 15 16 17 18 19 20 21 22 23 24 25 26 27 28 29 30 31 32 33 34 35 36 37 38 39 40 41 42 43 44 45 46 47 48 49 50 51 52 53 54 55 56 57 58 59 60 61 62 63 64 65 66 67 68 69 70 71 72 73 74 75 76 77 78 79 80 81 82 83 84 85 86 87 88 89 90 91 92 93 94 95 96 97 98 99 100 101 102 103 104 105 106 107 108 109 110 111 112 113 114 115 116 117 118 119 120 121 122 123 124 125 126 127 128 129 130 131 132 133 |
# trace generated using paraview version 5.6.3 # # To ensure correct image size when batch processing, please search # for and uncomment the line `# renderView*.ViewSize = [*,*]` #### import the simple module from the paraview from paraview.simple import * #### disable automatic camera reset on 'Show' paraview.simple._DisableFirstRenderCameraReset() # create a new 'OpenFOAMReader' postfoam = OpenFOAMReader(FileName='/home/kamakiri/Desktop/OpenFOAM/damBreak_snappyHexMesh_less_less_blog/post.foam') # get animation scene animationScene1 = GetAnimationScene() # update animation scene based on data timesteps animationScene1.UpdateAnimationUsingDataTimeSteps() # get active view renderView1 = GetActiveViewOrCreate('RenderView') # uncomment following to set a specific view size # renderView1.ViewSize = [1503, 434] # show data in view postfoamDisplay = Show(postfoam, renderView1) # trace defaults for the display properties. postfoamDisplay.Representation = 'Surface' # reset view to fit data renderView1.ResetCamera() # show color bar/color legend postfoamDisplay.SetScalarBarVisibility(renderView1, True) # update the view to ensure updated data information renderView1.Update() # get color transfer function/color map for 'p' pLUT = GetColorTransferFunction('p') # get opacity transfer function/opacity map for 'p' pPWF = GetOpacityTransferFunction('p') # reset view to fit data renderView1.ResetCamera() # create a new 'Slice' slice1 = Slice(Input=postfoam) # toggle 3D widget visibility (only when running from the GUI) Hide3DWidgets(proxy=slice1.SliceType) # Properties modified on slice1.SliceType slice1.SliceType.Normal = [0.0, 1.0, 0.0] # Properties modified on slice1.SliceType slice1.SliceType.Normal = [0.0, 1.0, 0.0] # show data in view slice1Display = Show(slice1, renderView1) # trace defaults for the display properties. slice1Display.Representation = 'Surface' # hide data in view Hide(postfoam, renderView1) # show color bar/color legend slice1Display.SetScalarBarVisibility(renderView1, True) # update the view to ensure updated data information renderView1.Update() # create a new 'Contour' contour1 = Contour(Input=slice1) # Properties modified on contour1 contour1.ContourBy = ['POINTS', 'alpha.water'] contour1.Isosurfaces = [0.5] # show data in view contour1Display = Show(contour1, renderView1) # trace defaults for the display properties. contour1Display.Representation = 'Surface' # hide data in view Hide(slice1, renderView1) # show color bar/color legend contour1Display.SetScalarBarVisibility(renderView1, True) # update the view to ensure updated data information renderView1.Update() # get layout layout1 = GetLayout() # split cell layout1.SplitHorizontal(0, 0.5) # set active view SetActiveView(None) # Create a new 'SpreadSheet View' spreadSheetView1 = CreateView('SpreadSheetView') spreadSheetView1.ColumnToSort = '' spreadSheetView1.BlockSize = 1024L # uncomment following to set a specific view size # spreadSheetView1.ViewSize = [400, 400] # place view in the layout layout1.AssignView(2, spreadSheetView1) # show data in view contour1Display_1 = Show(contour1, spreadSheetView1) # export view ExportView('/home/kamakiri/Desktop/OpenFOAM/damBreak_snappyHexMesh_less_less_blog/paraview_post/height_water.csv', view=spreadSheetView1) #### saving camera placements for all active views # current camera placement for renderView1 renderView1.CameraPosition = [1.6100000143051147, -6.794078149091664, 0.5] renderView1.CameraFocalPoint = [1.6100000143051147, 0.0, 0.5] renderView1.CameraViewUp = [0.0, 0.0, 1.0] renderView1.CameraParallelScale = 1.758436818899806 #### uncomment the following to render all views # RenderAllViews() # alternatively, if you want to write images, you can use SaveScreenshot(...). |
Pythonスクリプトの読み込み
先ほど作成したPythonスクリプトを読み込んで操作の再現を行います。
Paraviewから読み込み
Paraviewを起動してPython Shellが表示されていることを確認します。
表示されていない場合は「View」>「Python Shell」にチェックを入れます。


“Run Scrip”から実行
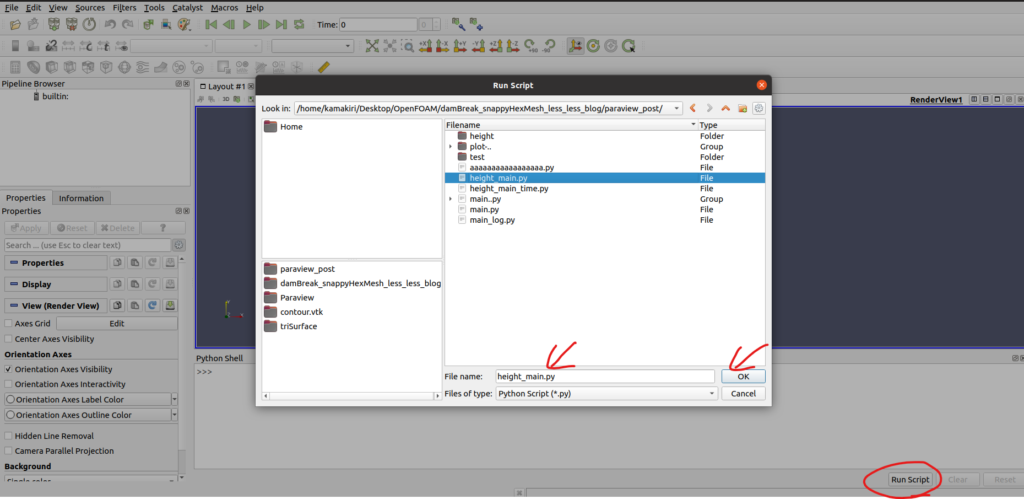

自動で読み込まれます。
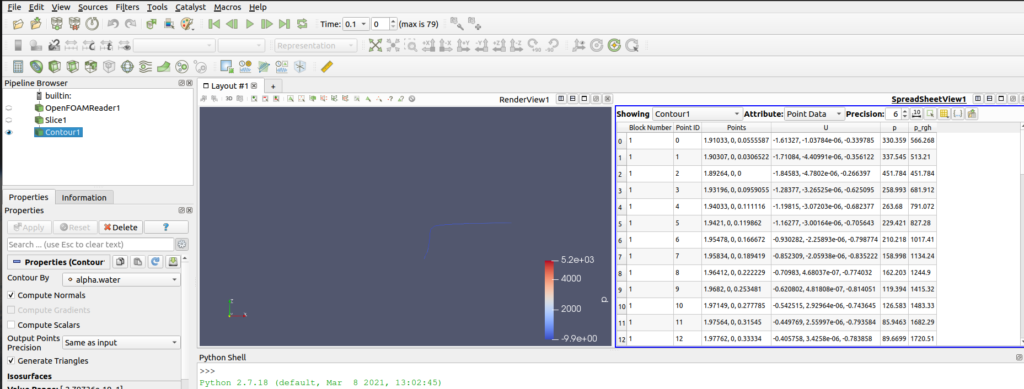


コマンドのオプションでParaviewを起動
コマンドでParaviewをPythonスクリプトを読み込ませて起動させることができます。
ターミナル上で以下のコマンドを打ちます。
|
1 |
paraview --script=height_main.py |
自動で読み込まれます。


pvpython
Pythonスクリプトの操作の記録の中には水面高さによるデータを出力する操作も含まれています。以下の部分ですね。
|
1 2 |
# export view ExportView('/home/kamakiri/Desktop/OpenFOAM/damBreak_snappyHexMesh_less_less_blog/paraview_post/height_water.csv', view=spreadSheetView1) |
水面高さを知りたいだけならParaviewを起動させずにcsvファイルだけを出力できるといいですよね。
PvPythonはParaViewのPythonインターフェイスを備えたParaViewと考えることができます。pvpythonにコマンドを手動で入力できます。
ターミナル上で以下のコマンドを打ちます。
|
1 |
pvpython |
以下のような対話型に変わります。
|
1 2 3 4 |
Python 2.7.18 (default, Mar 8 2021, 13:02:45) [GCC 9.3.0] on linux2 Type "help", "copyright", "credits" or "license" for more information. >>> |
Paraview内で使われているPythonのバージョンが2.7.18となっています。
最新のPythonのバージョンは3系なので注意が必要ですね。バージョン2系と3系ではずいぶん記述方法が変わったので、注意しないと思わぬエラーが出ます。(Paraview内のPythonを3系にアップデートすれば良いのですが、それは追々_(._.)_)
以下のように実行するとPythonのライブラリのインストール先が確認できます。
|
1 2 3 |
>>> import sys >>> sys.path ['', '/opt/OpenFOAM/ThirdParty-v2006/platforms/linux64Gcc/ParaView-5.6.3/lib/python2.7/site-packages', '/usr/lib/python2.7', '/usr/lib/python2.7/plat-x86_64-linux-gnu', '/usr/lib/python2.7/lib-tk', '/usr/lib/python2.7/lib-old', '/usr/lib/python2.7/lib-dynload', '/usr/local/lib/python2.7/dist-packages', '/usr/lib/python2.7/dist-packages']PPytho |
Pythonスクリプトは以下のコマンド実行できます。
|
1 |
pvpython height_main.py |
Paraviewは起動されませんが、フォルダ内に「height_water.csv」が出力されます。
結果のグラフ化は後半にgnuplotで行います。
時間指定で出力
先ほどまではPythonスクリプトを実行しても初期状態の水面高さのcsvファイルしか出力されませんでしたが、計算時間(0~8秒)の1秒ごとのデータがほしいのですね。
まずは、時間指定で出力できるようにします。
height_main.pyは、
|
1 |
postfoam = OpenFOAMReader(FileName='/home/kamakiri/Desktop/OpenFOAM/damBreak_snappyHexMesh_less_less_blog/post.foam') |
で読み込んでいるので、この後くらいに時間指定の記述を書いておきます。
|
1 2 3 4 |
# get animation scene ani_time = 5 animationScene1 = GetAnimationScene() animationScene1.AnimationTime = ani_time # animationScene1.AnimationTime = 5 |
「animationScene1.AnimationTime = 指定時間」とします。
0~8秒の時間がほしいので「ani_time = 5」と変数定義しておきます。
ステップ数ではなく時間なのでもっと細かくしたい場合は0.1刻みで指定しても良いでしょう。


csvファイルも指定した時間でファイル名を区別したいので変数を使います。
|
1 2 3 |
# export view export_heigth = '/home/kamakiri/Desktop/OpenFOAM/damBreak_snappyHexMesh_less_less_blog/paraview_post/height_' + str(ani_time) + 'sec.csv' ExportView(export_heigth, view=spreadSheetView1) |
※Python3系だと文字列の中に以下のようにフォーマット文字列が使えるのですが、2系だと使えないので上記のように記述する必要があります。
|
1 2 |
# この書き方はPython3系(2系では使えない) export_heigth = f'/home/kamakiri/Desktop/OpenFOAM/damBreak_snappyHexMesh_less_less_blog/paraview_post/height_{str(ani_time)}sec.csv' |
全体のコードはこちら↓
|
1 2 3 4 5 6 7 8 9 10 11 12 13 14 15 16 17 18 19 20 21 22 23 24 25 26 27 28 29 30 31 32 33 34 35 36 37 38 39 40 41 42 43 44 45 46 47 48 49 50 51 52 53 54 55 56 57 58 59 60 61 62 63 64 65 66 67 68 69 70 71 72 73 74 75 76 77 78 79 80 81 82 83 84 85 86 87 88 89 90 91 92 93 94 95 96 97 98 99 100 101 102 103 104 105 106 107 108 109 110 111 112 113 114 115 116 117 118 119 120 121 122 123 124 125 126 127 128 129 130 131 132 133 134 135 136 137 |
# trace generated using paraview version 5.6.3 # # To ensure correct image size when batch processing, please search # for and uncomment the line `# renderView*.ViewSize = [*,*]` #### import the simple module from the paraview from paraview.simple import * #### disable automatic camera reset on 'Show' paraview.simple._DisableFirstRenderCameraReset() # create a new 'OpenFOAMReader' postfoam = OpenFOAMReader(FileName='/home/kamakiri/Desktop/OpenFOAM/damBreak_snappyHexMesh_less_less_blog/post.foam') # get animation scene ani_time = 5 animationScene1 = GetAnimationScene() animationScene1.AnimationTime = ani_time # animationScene1.AnimationTime = 5 # update animation scene based on data timesteps animationScene1.UpdateAnimationUsingDataTimeSteps() # get active view renderView1 = GetActiveViewOrCreate('RenderView') # uncomment following to set a specific view size # renderView1.ViewSize = [1503, 434] # show data in view postfoamDisplay = Show(postfoam, renderView1) # trace defaults for the display properties. postfoamDisplay.Representation = 'Surface' # reset view to fit data renderView1.ResetCamera() # show color bar/color legend postfoamDisplay.SetScalarBarVisibility(renderView1, True) # update the view to ensure updated data information renderView1.Update() # get color transfer function/color map for 'p' pLUT = GetColorTransferFunction('p') # get opacity transfer function/opacity map for 'p' pPWF = GetOpacityTransferFunction('p') # reset view to fit data renderView1.ResetCamera() # create a new 'Slice' slice1 = Slice(Input=postfoam) # Properties modified on slice1.SliceType slice1.SliceType.Normal = [0.0, 1.0, 0.0] # Properties modified on slice1.SliceType slice1.SliceType.Normal = [0.0, 1.0, 0.0] # show data in view slice1Display = Show(slice1, renderView1) # trace defaults for the display properties. slice1Display.Representation = 'Surface' # hide data in view Hide(postfoam, renderView1) # show color bar/color legend slice1Display.SetScalarBarVisibility(renderView1, True) # update the view to ensure updated data information renderView1.Update() # toggle 3D widget visibility (only when running from the GUI) Hide3DWidgets(proxy=slice1.SliceType) # create a new 'Contour' contour1 = Contour(Input=slice1) # Properties modified on contour1 contour1.ContourBy = ['POINTS', 'alpha.water'] contour1.Isosurfaces = [0.5] # show data in view contour1Display = Show(contour1, renderView1) # trace defaults for the display properties. contour1Display.Representation = 'Surface' # hide data in view Hide(slice1, renderView1) # show color bar/color legend contour1Display.SetScalarBarVisibility(renderView1, True) # update the view to ensure updated data information renderView1.Update() # get layout layout1 = GetLayout() # split cell layout1.SplitHorizontal(0, 0.5) # set active view SetActiveView(None) # Create a new 'SpreadSheet View' spreadSheetView1 = CreateView('SpreadSheetView') spreadSheetView1.ColumnToSort = '' spreadSheetView1.BlockSize = 1024L # uncomment following to set a specific view size # spreadSheetView1.ViewSize = [400, 400] # place view in the layout layout1.AssignView(2, spreadSheetView1) # show data in view contour1Display_1 = Show(contour1, spreadSheetView1) # export view export_heigth = '/home/kamakiri/Desktop/OpenFOAM/damBreak_snappyHexMesh_less_less_blog/paraview_post/height_' + str(ani_time) + 'sec.csv' ExportView(export_heigth, view=spreadSheetView1) #### saving camera placements for all active views # current camera placement for renderView1 renderView1.CameraPosition = [1.6100000143051147, -6.794078149091664, 0.5] renderView1.CameraFocalPoint = [1.6100000143051147, 0.0, 0.5] renderView1.CameraViewUp = [0.0, 0.0, 1.0] renderView1.CameraParallelScale = 1.758436818899806 #### uncomment the following to render all views # RenderAllViews() # alternatively, if you want to write images, you can use SaveScreenshot(...). |
ターミナル上で以下のコマンドを打ちます。
|
1 |
pvpython height_main_time.py |
もしくは
|
1 |
paraview --script=height_main_time.py |
として結果が正常に読み込めているかを確認しましょう。
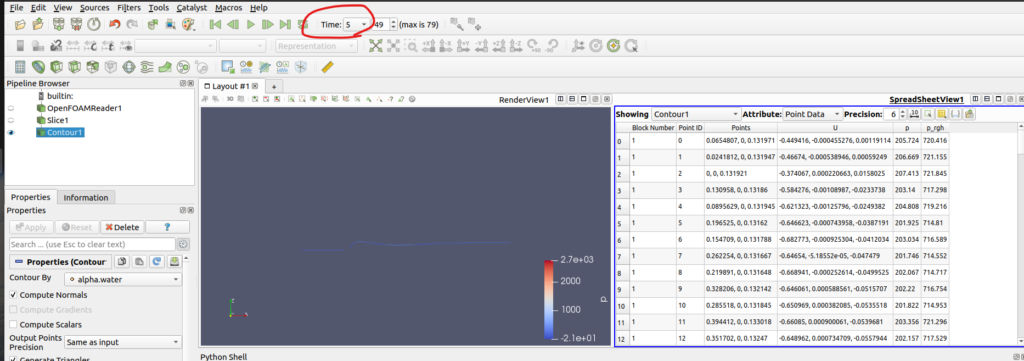

1秒ごとにファイル出力
先ほどのファイルを少し修正します。
for文にして各時間でループを回すようにしました。
|
1 2 3 |
alltime = 8 for t in range(alltime + 1): #処理 |
|
1 2 3 4 5 6 7 8 9 10 11 12 13 14 15 16 17 18 19 20 21 22 23 24 25 26 27 28 29 30 31 32 33 34 35 36 37 38 39 40 41 42 43 44 45 46 47 48 49 50 51 52 53 54 55 56 57 58 59 60 61 62 63 64 65 66 67 68 69 70 71 72 73 74 75 76 77 78 79 80 81 82 83 84 85 86 87 88 89 90 91 92 93 94 95 96 97 98 99 100 101 102 103 104 105 106 107 108 109 110 111 112 113 114 115 116 117 118 119 120 121 122 123 124 125 126 127 128 129 130 131 132 133 134 135 136 137 138 139 |
# trace generated using paraview version 5.6.3 # # To ensure correct image size when batch processing, please search # for and uncomment the line `# renderView*.ViewSize = [*,*]` #### import the simple module from the paraview from paraview.simple import * #### disable automatic camera reset on 'Show' paraview.simple._DisableFirstRenderCameraReset() # create a new 'OpenFOAMReader' postfoam = OpenFOAMReader(FileName='/home/kamakiri/Desktop/OpenFOAM/damBreak_snappyHexMesh_less_less_blog/post.foam') alltime = 8 for t in range(alltime+1): # get animation scene ani_time = t animationScene1 = GetAnimationScene() animationScene1.AnimationTime = ani_time # animationScene1.AnimationTime = 5 # update animation scene based on data timesteps animationScene1.UpdateAnimationUsingDataTimeSteps() # get active view renderView1 = GetActiveViewOrCreate('RenderView') # uncomment following to set a specific view size # renderView1.ViewSize = [1503, 434] # show data in view postfoamDisplay = Show(postfoam, renderView1) # trace defaults for the display properties. postfoamDisplay.Representation = 'Surface' # reset view to fit data renderView1.ResetCamera() # show color bar/color legend postfoamDisplay.SetScalarBarVisibility(renderView1, True) # update the view to ensure updated data information renderView1.Update() # get color transfer function/color map for 'p' pLUT = GetColorTransferFunction('p') # get opacity transfer function/opacity map for 'p' pPWF = GetOpacityTransferFunction('p') # reset view to fit data renderView1.ResetCamera() # create a new 'Slice' slice1 = Slice(Input=postfoam) # Properties modified on slice1.SliceType slice1.SliceType.Normal = [0.0, 1.0, 0.0] # Properties modified on slice1.SliceType slice1.SliceType.Normal = [0.0, 1.0, 0.0] # show data in view slice1Display = Show(slice1, renderView1) # trace defaults for the display properties. slice1Display.Representation = 'Surface' # hide data in view Hide(postfoam, renderView1) # show color bar/color legend slice1Display.SetScalarBarVisibility(renderView1, True) # update the view to ensure updated data information renderView1.Update() # toggle 3D widget visibility (only when running from the GUI) Hide3DWidgets(proxy=slice1.SliceType) # create a new 'Contour' contour1 = Contour(Input=slice1) # Properties modified on contour1 contour1.ContourBy = ['POINTS', 'alpha.water'] contour1.Isosurfaces = [0.5] # show data in view contour1Display = Show(contour1, renderView1) # trace defaults for the display properties. contour1Display.Representation = 'Surface' # hide data in view Hide(slice1, renderView1) # show color bar/color legend contour1Display.SetScalarBarVisibility(renderView1, True) # update the view to ensure updated data information renderView1.Update() # get layout layout1 = GetLayout() # split cell layout1.SplitHorizontal(0, 0.5) # set active view SetActiveView(None) # Create a new 'SpreadSheet View' spreadSheetView1 = CreateView('SpreadSheetView') spreadSheetView1.ColumnToSort = '' spreadSheetView1.BlockSize = 1024L # uncomment following to set a specific view size # spreadSheetView1.ViewSize = [400, 400] # place view in the layout layout1.AssignView(2, spreadSheetView1) # show data in view contour1Display_1 = Show(contour1, spreadSheetView1) # export view export_heigth = '/home/kamakiri/Desktop/OpenFOAM/damBreak_snappyHexMesh_less_less_blog/paraview_post/height_' + str(ani_time) + 'sec.csv' ExportView(export_heigth, view=spreadSheetView1) #### saving camera placements for all active views # current camera placement for renderView1 renderView1.CameraPosition = [1.6100000143051147, -6.794078149091664, 0.5] renderView1.CameraFocalPoint = [1.6100000143051147, 0.0, 0.5] renderView1.CameraViewUp = [0.0, 0.0, 1.0] renderView1.CameraParallelScale = 1.758436818899806 #### uncomment the following to render all views # RenderAllViews() # alternatively, if you want to write images, you can use SaveScreenshot(...). |
ターミナル上で以下のコマンドを打ちます。
|
1 |
pvpython height_main_Alltime.py |
何やらエラーが出ますがcsvファイルは正常に出力してくれています。

gnuplotで可視化
先ほど出力したcsvファイルはgnuplotでグラフ化するのが簡単ですね。
ターミナル上で「gnuplot」と打ってgnuplotを起動します。
|
1 2 3 4 5 6 7 8 9 10 11 12 13 14 |
$gnuplot G N U P L O T Version 5.2 patchlevel 8 last modified 2019-12-01 Copyright (C) 1986-1993, 1998, 2004, 2007-2019 Thomas Williams, Colin Kelley and many others gnuplot home: http://www.gnuplot.info faq, bugs, etc: type "help FAQ" immediate help: type "help" (plot window: hit 'h') Terminal type is now 'qt' gnuplot> |
対話モードになったらデータをプロットします。


- 横軸:6列目(x座標)
- 縦軸:8列目(z座標)
なので、以下のように列指定でプロットしようとするとエラーがでました。
|
1 2 3 4 |
plot "height_0sec.csv" us 6:8 warning: Skipping data file with no valid points ^ x range is invalid |
データがカンマ区切りなのでエラーが出たようです。
|
1 |
set datafile separator "," |
と打って再度プロットさせます。
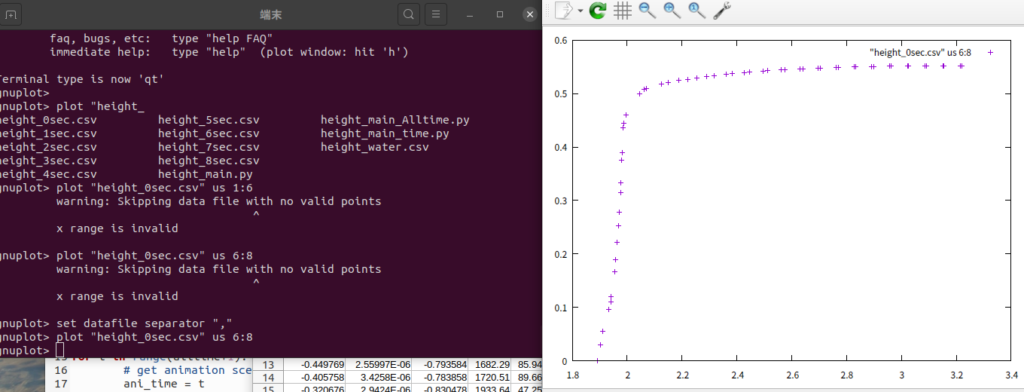
|
1 |
plot "height_0sec.csv" us 6:8 |
上手くいきました。
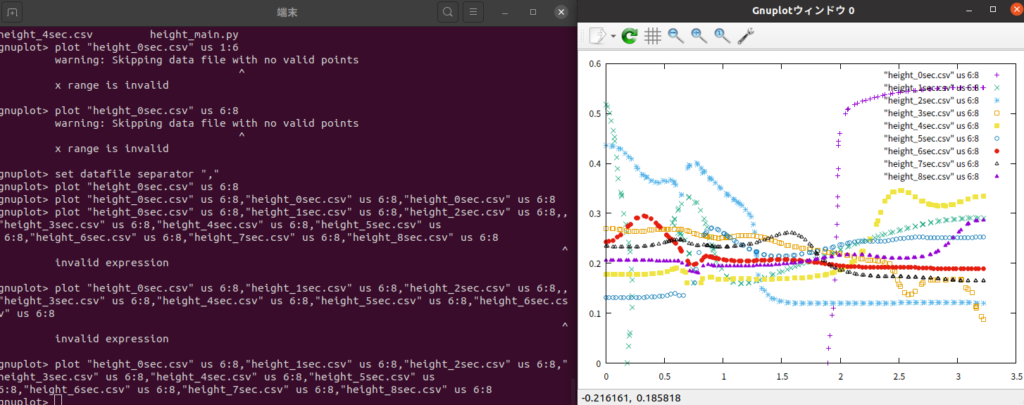
1秒ごとのデータを重ねてみます。
ベタでですが以下のようにしてプロットします。(gnuplotもスクリプトにして繰り返し文など使えるのですが、ここではべた書きしておきます)
|
1 2 |
plot "height_0sec.csv" us 6:8,"height_1sec.csv" us 6:8,"height_2sec.csv" us 6:8,"height_3sec.csv" us 6:8,"height_4sec.csv" us 6:8,"height_5sec.csv" us 6:8,"height_6sec.csv" us 6:8,"height_7sec.csv" us 6:8,"height_8sec.csv" us 6:8 |
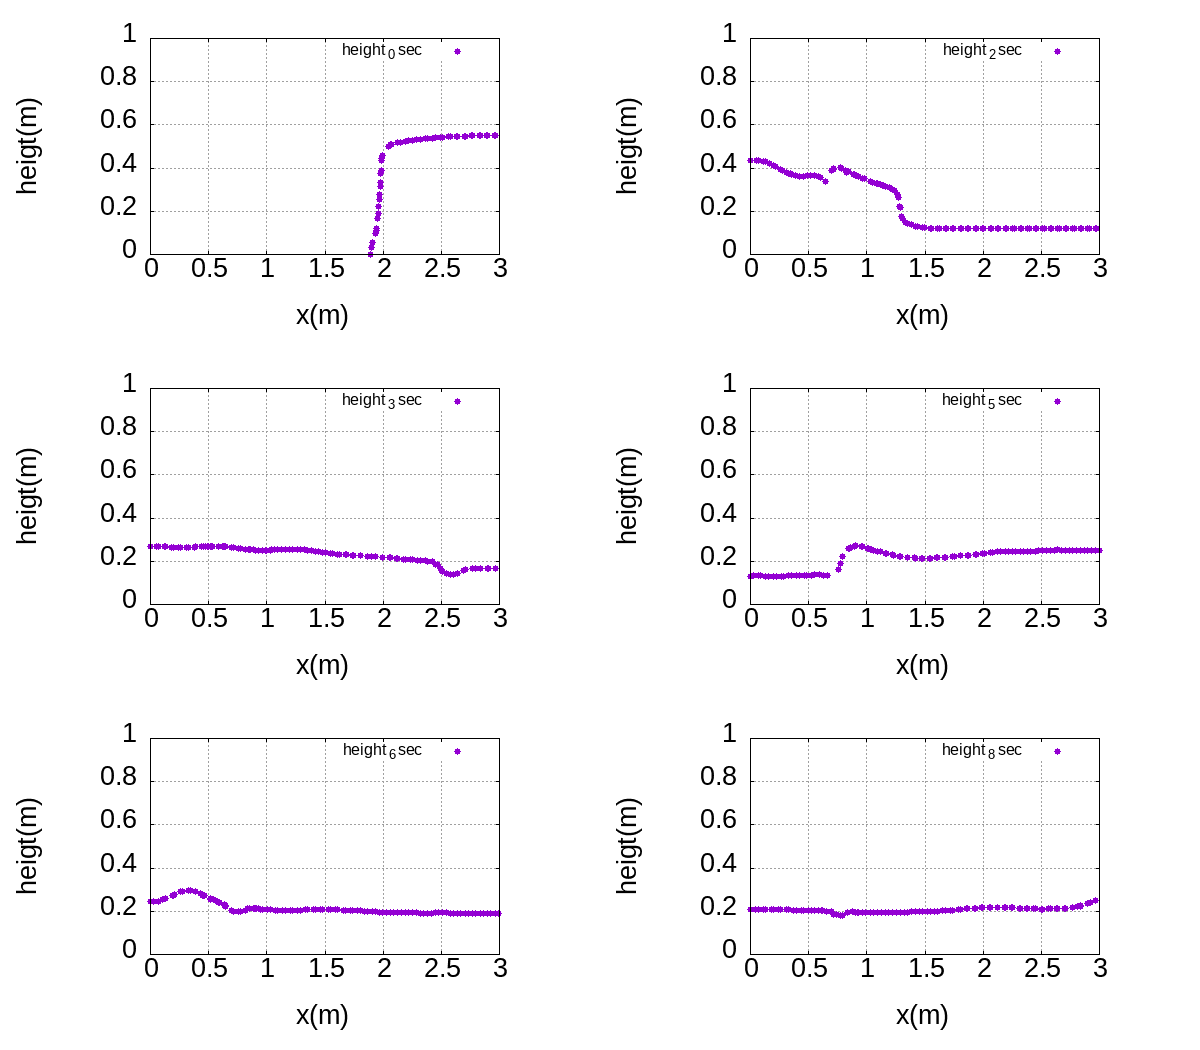
データが多くてカオスですが、水面高さの時刻歴変化をプロットできました。
gnuplotでアニメーション作成
さきほど作成した水面高さのグラフを繋げてアニメーションにします。
Paraviewで水面高さのアニメーションは見れるので、ここでもう一回アニメーションに作り替えるのは意味がないことですが、アニメーション作成方法のメモとして残しておきます。
gnuplotもスクリプトとして保存できるので以下のようにします。
|
1 2 3 4 5 6 7 8 9 10 11 12 13 14 15 16 17 18 19 20 21 22 23 24 25 |
# # gnuplot script generated by movie_script.f90 # set xlabel 'x(m)' offset 0,-1 # x-axis set ylabel 'heigt(m)' offset -5,0 # y-axis set xrange[0: 3 ] # x range set yrange[0: 1 ] # height range set grid set xlabel font 'Arial,20' set ylabel font 'Arial,20' set tics font 'Arial,20' set datafile separator ',' set lmargin 15 set tmargin 2 set rmargin 10 set bmargin 5 set term gif animate optimize delay 100 size 700,600 # 出力をgifアニメに設定 set output "heitht.gif" # 出力ファイル名の設定 do for [i=0:8]{ plot 'height_'.i.'sec.csv' us 6:8 ps 1 pt 7 title 'height_'.i.'sec pause 1 } pause -1 |
ターミナル上で以下のコマンドを打ちます。
|
1 |
gnuplot movie_script |
もしくはgnuplotを起動してloadで読み込みます。
|
1 2 3 |
gnuplot #画面が切り替わってgnuplotが起動 load "gnuplot movie_script" |
このように「heitht.gif」というファイル名でアニメーションができます。
まとめ
今回はParaviewで水面高さを出力する方法を解説しました。
少し手間ですがスクリプトを上手く書いてカスタマイズすれば自動化ができそうですね。
実験ではx方向に
- H1=0.496m
- H2=0.992m
- H3=1.488m
- H4=2.638m
のポイントで水面高さを出力しています。


今回作成したcsvファイルから指定のx座標での水面の高さ(z座標)の時刻歴を作成すれば、指定した座標での水面高さの時刻歴が作成できますね。
参考書
PENGUINさんサイトを体系的に学べる書籍となっています。ネット記事でも十分勉強できるのですが、OpenFOAMの初学者でOpenFOAMをインストール済みであれば一冊持って置き、体系的に学ぶのが良いでしょう。
あとは初心者向けに丁寧に解説がされているこちらの書籍もお勧めです。最後の章にはオーバーセットメッシュ(重合メッシュ)の機能を使った解析を最後まで丁寧に解説しているので挫折することはないでしょう。
OpenFOAMの歩き方 (技術の泉シリーズ(NextPublishing))
