こんにちは(@t_kun_kamakiri)(‘◇’)ゞ
前回の記事で1次元熱伝導方程式をFortranで解いて、1次元のグラフのアニメーションをgnuplotで作成するというのをしました。
↑この記事でのアニメーション結果はこちら。
gnuplotでのアニメーションはこんな感じ
Fortranは可視化ツールがないので仕方なくgnuplotのスクリプトを書いてグラフのアニメーションを作りました。
今回は、1次元熱伝導方程式をPythonで解いてグラフのアニメーションまで作成したいと思います。
Pythonの初学者のための記事です。
※Pythonの動作にはJupyter Notebookを使用しています。
Pythonの使用環境
Pythonの使用環境は色々あると思います。
以下に代表的なものを紹介しておきます。
②AnacondaをインストールしてJupyter notebookを使用
④visual studioをインストールしてPythonを使用
1次元熱伝導方程式を離散化して解く
解きたい方程式は、下記の記事でも詳しく解説しています。
Pythonで解きたい方程式は↓こちらです。
ある地点\(x_{i}\)での時間微分の項
T^{n+1}(x_{i})=T^{n}(x_{i})+\kappa dt\frac{T^{n}(x_{i}+\Delta x)-2T^{n}(x_{i})-T^{n}(x_{i}-\Delta x)}{\Delta x^2}
\tag{4}\end{align*}
Pythonで解いて1次元のアニメーション
Pythonのコードを載せておきましょう。
|
1 2 3 4 5 6 7 8 9 10 11 12 13 14 15 16 17 18 19 20 21 22 23 24 25 26 27 28 29 30 31 32 33 34 35 36 37 38 39 40 41 42 43 44 45 46 47 48 49 |
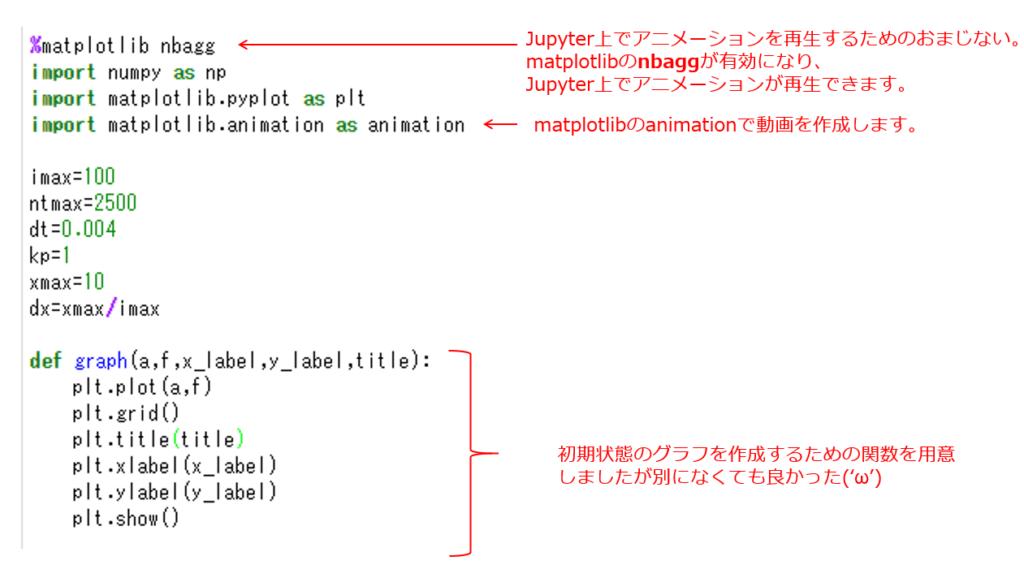
%matplotlib nbagg import numpy as np import matplotlib.pyplot as plt import matplotlib.animation as animation imax=100 ntmax=2500 dt=0.004 kp=1 xmax=10 dx=xmax/imax def graph(a,f,x_label,y_label,title): plt.plot(a,f) plt.grid() plt.title(title) plt.xlabel(x_label) plt.ylabel(y_label) plt.show() X = np.linspace(0, xmax, imax) #initial state temp=[] for i in range(imax): x=dx*i if (i<imax/2): temp.append(x) else: temp.append(xmax-x) graph(X,temp,"x","temperature(K)","Initial state") fig = plt.figure() ims=[] for t in range(0,ntmax): for i in range(1,imax-1): temp[i]=temp[i]+kp*dt/(dx*dx)*(temp[i+1]-2*temp[i]+temp[i-1]) if (t%100==0): im = plt.plot(X,temp, "r") ims.append(im) plt.grid() plt.xlabel("x") plt.ylabel("temperature(K)") ims = animation.ArtistAnimation(fig, ims) #plt.show() |
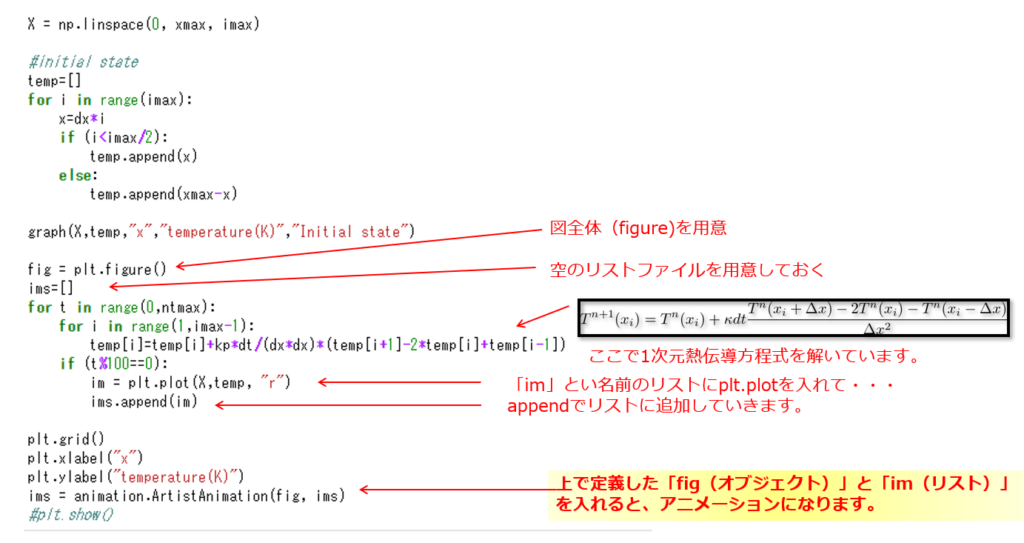
プログラムの簡単な解説をしておきます。


【参考リンク】
Pythonのアニメーションの結果
上のPythonをJupyter notebookで動かすとこんな感じ。
計算はすぐ終わるので、これくらいの軽い計算なら言語の違いは出なさそうです。


