格子ボルツマン法って何でしょうか?
僕は詳しくありません(笑)
格子ボルツマン法が何かはさておき、シミュレーションしてから理解するという所謂「形から入る」ということでPythonを用いてシミュレーションのソースコードを走らせてみました。
こちらのURLを参考にしています。
格子ボルツマン法のソースコード入手先
目的
とりあえずPythonを用いて格子ボルツマン法で流体の数値計算を実行してみます。
>>こちらにドキュメントもありますので詳しく知りたい方はどうぞ。(英文だが)
やることは、
格子ボルツマン法のソースコード入手先
よりPythonのソースコードを入手。
↓
Pythonのソースコード(Python2系)をPyhon3系に修正
↓
外部モジュール(numpy、matplotlib)のインストール
↓
Pythonの実行
環境
Windows10
Python3.6.4
(コマンドプロンプトからpythonを起動)
Pythonのインストール
Pythonはこちらからインストールできます。
https://qiita.com/taiponrock/items/f574dd2cddf8851fb02c
外部ライブラリのインストール
本記事のソースコードをPythonで実行するには以下の2つの外部モジュール(numpy、matplotlib)がインストールされている必要があります。
以下にインストールするにあたってわかりやすいサイトを添付しておきますので、これを参考に外部モジュールをインストールすることでコマンドプロンプトからPythonの計算が実行できます。
numpyのインストール
https://qiita.com/kenichi-t/items/7319b3876ae7f0d3817c
matplotlibのインストール
https://qiita.com/Morio/items/d75159bac916174e7654
Pythonコードの修正(Python2系→Python3系)
Pythonのソースコードを走らせてみたいと思うのですが、http://physics.weber.edu/schroeder/fluids/のPythonコードは2系で書かれています。
最近のPythonはバージョンアップされているため、例えばPython3.6.4(Python3系)で実行するためには、少し修正が必要となります。
Python2系を扱ったことがないので、詳しくは知りませんが以下の修正を行うことでPython3系でも正常に計算実行できます。
修正その1
【修正前】
|
1 |
barrier[(height/2)-8:(height/2)+8, (height/2)] = True |
これでは配列部分が実数になるので、以下のように整数型になるように修正する必要があります。
【修正後】
|
1 |
barrier[int(height/2)-8:int(height/2)+8, int(height/2)] = True |
修正その2
【修正前】
|
1 |
print "%1.1f" % (100/(endTime-startTime)), 'frames per second' |
これはpython2系の書き方である。python3系では以下ののように()でくくる必要があります。
【修正後】
|
1 |
print ("%1.1f" % (100/(endTime-startTime)), 'frames per second') |
修正が終わったので、コマンドプロンプトを起動して、以下をタイプして計算実行してみましょう。
※ファイルの保存の際は、文字コードはUTF-8を選択
格子ボルツマン法のPythonコードを実行
コマンドプロンプトを立ち上げて以下を打ち込みます。
|
1 |
python Lattice_Boltzman.py |
サンプルコードは以下に示します。(余計なコメントが多かったので、シンプルにしました。)
|
1 2 3 4 5 6 7 8 9 10 11 12 13 14 15 16 17 18 19 20 21 22 23 24 25 26 27 28 29 30 31 32 33 34 35 36 37 38 39 40 41 42 43 44 45 46 47 48 49 50 51 52 53 54 55 56 57 58 59 60 61 62 63 64 65 66 67 68 69 70 71 72 73 74 75 76 77 78 79 80 81 82 83 84 85 86 87 88 89 90 91 92 93 94 95 96 97 98 99 100 101 102 103 104 105 106 107 108 109 110 111 112 113 114 115 116 117 118 119 120 121 122 123 124 125 126 127 128 129 130 131 |
#ファイル名:Lattice_Boltzman.py import numpy import time import matplotlib.pyplot import matplotlib.animation %matplotlib nbagg #↑jupyter notebookを使っている方はこれを書いてください。 # Define constants: height = 80 # lattice dimensions width = 200 viscosity = 0.02 # fluid viscosity omega = 1 / (3*viscosity + 0.5) # "relaxation" parameter u0 = 0.1 # initial and in-flow speed four9ths = 4.0/9.0 # abbreviations for lattice-Boltzmann weight factors one9th = 1.0/9.0 one36th = 1.0/36.0 performanceData = False # set to True if performance data is desired # Initialize all the arrays to steady rightward flow: n0 = four9ths * (numpy.ones((height,width)) - 1.5*u0**2) # particle densities along 9 directions nN = one9th * (numpy.ones((height,width)) - 1.5*u0**2) nS = one9th * (numpy.ones((height,width)) - 1.5*u0**2) nE = one9th * (numpy.ones((height,width)) + 3*u0 + 4.5*u0**2 - 1.5*u0**2) nW = one9th * (numpy.ones((height,width)) - 3*u0 + 4.5*u0**2 - 1.5*u0**2) nNE = one36th * (numpy.ones((height,width)) + 3*u0 + 4.5*u0**2 - 1.5*u0**2) nSE = one36th * (numpy.ones((height,width)) + 3*u0 + 4.5*u0**2 - 1.5*u0**2) nNW = one36th * (numpy.ones((height,width)) - 3*u0 + 4.5*u0**2 - 1.5*u0**2) nSW = one36th * (numpy.ones((height,width)) - 3*u0 + 4.5*u0**2 - 1.5*u0**2) rho = n0 + nN + nS + nE + nW + nNE + nSE + nNW + nSW # macroscopic density ux = (nE + nNE + nSE - nW - nNW - nSW) / rho # macroscopic x velocity uy = (nN + nNE + nNW - nS - nSE - nSW) / rho # macroscopic y velocity # Initialize barriers: barrier = numpy.zeros((height,width), bool) # True wherever there's a barrier barrier[int(height/2)-8:int(height/2)+8, int(height/2)] = True # simple linear barrier barrierN = numpy.roll(barrier, 1, axis=0) # sites just north of barriers barrierS = numpy.roll(barrier, -1, axis=0) # sites just south of barriers barrierE = numpy.roll(barrier, 1, axis=1) # etc. barrierW = numpy.roll(barrier, -1, axis=1) barrierNE = numpy.roll(barrierN, 1, axis=1) barrierNW = numpy.roll(barrierN, -1, axis=1) barrierSE = numpy.roll(barrierS, 1, axis=1) barrierSW = numpy.roll(barrierS, -1, axis=1) # Move all particles by one step along their directions of motion (pbc): def stream(): global nN, nS, nE, nW, nNE, nNW, nSE, nSW nN = numpy.roll(nN, 1, axis=0) # axis 0 is north-south; + direction is north nNE = numpy.roll(nNE, 1, axis=0) nNW = numpy.roll(nNW, 1, axis=0) nS = numpy.roll(nS, -1, axis=0) nSE = numpy.roll(nSE, -1, axis=0) nSW = numpy.roll(nSW, -1, axis=0) nE = numpy.roll(nE, 1, axis=1) # axis 1 is east-west; + direction is east nNE = numpy.roll(nNE, 1, axis=1) nSE = numpy.roll(nSE, 1, axis=1) nW = numpy.roll(nW, -1, axis=1) nNW = numpy.roll(nNW, -1, axis=1) nSW = numpy.roll(nSW, -1, axis=1) # Use tricky boolean arrays to handle barrier collisions (bounce-back): nN[barrierN] = nS[barrier] nS[barrierS] = nN[barrier] nE[barrierE] = nW[barrier] nW[barrierW] = nE[barrier] nNE[barrierNE] = nSW[barrier] nNW[barrierNW] = nSE[barrier] nSE[barrierSE] = nNW[barrier] nSW[barrierSW] = nNE[barrier] # Collide particles within each cell to redistribute velocities (could be optimized a little more): def collide(): global rho, ux, uy, n0, nN, nS, nE, nW, nNE, nNW, nSE, nSW rho = n0 + nN + nS + nE + nW + nNE + nSE + nNW + nSW ux = (nE + nNE + nSE - nW - nNW - nSW) / rho uy = (nN + nNE + nNW - nS - nSE - nSW) / rho ux2 = ux * ux # pre-compute terms used repeatedly... uy2 = uy * uy u2 = ux2 + uy2 omu215 = 1 - 1.5*u2 # "one minus u2 times 1.5" uxuy = ux * uy n0 = (1-omega)*n0 + omega * four9ths * rho * omu215 nN = (1-omega)*nN + omega * one9th * rho * (omu215 + 3*uy + 4.5*uy2) nS = (1-omega)*nS + omega * one9th * rho * (omu215 - 3*uy + 4.5*uy2) nE = (1-omega)*nE + omega * one9th * rho * (omu215 + 3*ux + 4.5*ux2) nW = (1-omega)*nW + omega * one9th * rho * (omu215 - 3*ux + 4.5*ux2) nNE = (1-omega)*nNE + omega * one36th * rho * (omu215 + 3*(ux+uy) + 4.5*(u2+2*uxuy)) nNW = (1-omega)*nNW + omega * one36th * rho * (omu215 + 3*(-ux+uy) + 4.5*(u2-2*uxuy)) nSE = (1-omega)*nSE + omega * one36th * rho * (omu215 + 3*(ux-uy) + 4.5*(u2-2*uxuy)) nSW = (1-omega)*nSW + omega * one36th * rho * (omu215 + 3*(-ux-uy) + 4.5*(u2+2*uxuy)) # Force steady rightward flow at ends (no need to set 0, N, and S components): nE[:,0] = one9th * (1 + 3*u0 + 4.5*u0**2 - 1.5*u0**2) nW[:,0] = one9th * (1 - 3*u0 + 4.5*u0**2 - 1.5*u0**2) nNE[:,0] = one36th * (1 + 3*u0 + 4.5*u0**2 - 1.5*u0**2) nSE[:,0] = one36th * (1 + 3*u0 + 4.5*u0**2 - 1.5*u0**2) nNW[:,0] = one36th * (1 - 3*u0 + 4.5*u0**2 - 1.5*u0**2) nSW[:,0] = one36th * (1 - 3*u0 + 4.5*u0**2 - 1.5*u0**2) # Compute curl of the macroscopic velocity field: def curl(ux, uy): return numpy.roll(uy,-1,axis=1) - numpy.roll(uy,1,axis=1) - numpy.roll(ux,-1,axis=0) + numpy.roll(ux,1,axis=0) # Here comes the graphics and animation... theFig = matplotlib.pyplot.figure(figsize=(8,3)) fluidImage = matplotlib.pyplot.imshow(curl(ux, uy), origin='lower', norm=matplotlib.pyplot.Normalize(-.1,.1), cmap=matplotlib.pyplot.get_cmap('jet'), interpolation='none') # See http://www.loria.fr/~rougier/teaching/matplotlib/#colormaps for other cmap options bImageArray = numpy.zeros((height, width, 4), numpy.uint8) # an RGBA image bImageArray[barrier,3] = 255 # set alpha=255 only at barrier sites barrierImage = matplotlib.pyplot.imshow(bImageArray, origin='lower', interpolation='none') # Function called for each successive animation frame: startTime = time.clock() #frameList = open('frameList.txt','w') # file containing list of images (to make movie) def nextFrame(arg): # (arg is the frame number, which we don't need) global startTime if performanceData and (arg%100 == 0) and (arg > 0): endTime = time.clock() print ("%1.1f" % (100/(endTime-startTime)), 'frames per second') startTime = endTime #frameName = "frame%04d.png" % arg #matplotlib.pyplot.savefig(frameName) #frameList.write(frameName + '\n') for step in range(20): # adjust number of steps for smooth animation stream() collide() fluidImage.set_array(curl(ux, uy)) return (fluidImage, barrierImage) # return the figure elements to redraw animate = matplotlib.animation.FuncAnimation(theFig, nextFrame, interval=1, blit=True) matplotlib.pyplot.show() |
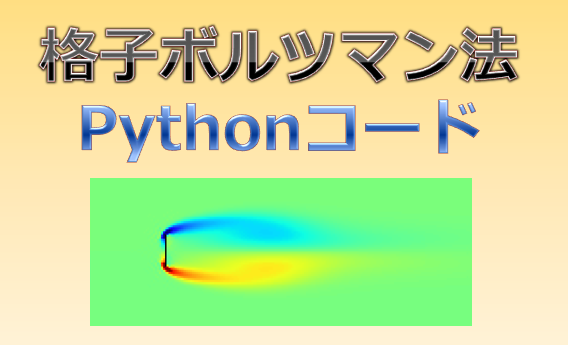
結果

まとめ
雛形のコードを修正するだけですぐに実行できました。
格子ボルツマン法の理解はまだできていないので、ドキュメントを読んで別途投稿しようと思います。
速度空間という考え方がキーになると思われます。
また、もともとはセルオートマトン法という考え方から来ていると思われますが勉強しないとわかりません(- -)


